goose Local Edition: a benchmark that runs the app your agent built
Mihai Perdum
Author
18 min readAugust 25, 2026
Start with the number that argues against us
Open the benchmark board and the current scorer era, sb-7.0, has seventeen entries. The top of it is GPT-5.6 Sol at 0.8166. The bottom two rows are ours: a three-node local fleet running qwen/qwen3.8-27b at 0.0172, and an older fleet run at 0.0154. Sixteenth and seventeenth of seventeen, on a benchmark we wrote ourselves.
Not one of the seventeen is marked excellent. Claude Opus 5 sits at 0.4695 on that board. Gemini 3.7 Flash is second at 0.7538. The spread from top to bottom is the whole point of the era, and the fact that our own entrant is at the bottom of it is the most useful thing I can tell you about the instrument.
Because a scorer era earlier — sb-5.3, still viewable behind the board's selector — the same fleet scored 0.9300 against an Opus 5 baseline of 0.9142, and I am not allowed to call that a win either. Opus's own repeat spread on that scorer, recorded in the app's baselines file, is 0.889–0.960. Our 0.93 lands inside it. The repository's README says it in one sentence and I am not going to improve on it: "inside Opus's own repeat spread (0.889–0.960 across reps), so the honest claim is parity, not victory." And parity there cost 11,394.7 seconds of wall clock against Opus's 1,170 — 9.7 times the wall for a 0.0158 difference that sits inside the baseline's own repeat spread.
Two eras, two opposite-looking results, one fleet. The rule that keeps both honest is printed on the board: scorer eras are never compared. sb-5.3, sb-6.0 and sb-7.0 grade three different applications with three different instruments. Putting 0.93 next to 0.0172 in a sentence and calling it a regression would be the single most dishonest thing this article could do, so I will say it once here and not again: those numbers do not belong in the same comparison.
This is a piece about what goose Local Edition is, and about the scorer, which is the part I think is actually worth your time whether or not you ever run our fork.
goose Local Edition is our fork, public at github.com/leanzero-srl/goose-local-edition. The fork point is upstream a0aed81f3 (3 July 2026), and the local-edition branch carries roughly 2,257 commits on top of it. It exists to answer one question: can several machines running the same local model, orchestrated properly, build working software of measurably higher quality than one machine running that model alone?
It adds three things to upstream goose.
A swarm engine (crates/goose-swarm plus the goose swarm CLI command) that plans, dispatches, supervises, verifies and repairs a software build across a pool of LM Studio devices — one model, several machines. A run moves through named phases: RESEARCH → PLAN → CONTRACTS → DETAIL → EXECUTE → COMPLETE. After the plan is agreed, a CONTRACTS phase freezes a signature-only interface per module before any implementation is dispatched, so workers code against each other's frozen contracts rather than each other's files.
A benchmark product — a page in the desktop app that runs the swarm against a frozen specification, scores the result by executing it, and publishes to the public board.
A measurement harness in evals/swarm-bench/ — the scorer, its controls, the run supervisor, and a findings ledger. That ledger is one file, evals/swarm-bench/nodeloop/FINDINGS.md, 21,150 lines long as I write this, numbered from F1 (1 August 2026) up to F925, and carrying 38 explicit refutation marks: 12 FALSIFIED, 21 REFUTED, 5 RETRACTED. Overturned claims stay in the file, struck and explained. If you want to understand the fork, that file is more use than the code.
The fleet in the published runs is three Apple-silicon Macs on LM Studio, all serving the same model identifier. I want to be precise about "the same model", because this is where local-AI writing usually goes vague. I asked LM Studio on this machine while writing this paragraph — lms ls --json reports every host's copy — and the three copies of qwen/qwen3.8-27b the fleet serves are not the same artefact:
host copy
quantisation
on disk
1
8-bit
29,528,355,154 bytes
2
6-bit
22,805,016,658 bytes
3
8-bit
29,528,355,154 bytes
4 rows × 3 columnsHeader row enabled
Three hosts, one identifier, two different quantisations — 8-bit on two machines and 6-bit on the third. That is a real limitation of the entry and I come back to it at the end. Qwen3.8-27B itself is Alibaba's dense 27.78B-parameter model, released under Apache 2.0 in August 2026 — days before that run was posted.
Why a local fork exists at all
Three reasons, none of them "local is better".
A different failure surface. A 27B-class local model does not fail the way a frontier model fails, and generic agent harnesses are tuned for the latter. Almost every mechanism in this fork exists because of a specific measured local failure: the agreement ladder that re-drafts plans when structural agreement stays low (measured at roughly 25 minutes per firing, and one traced firing spent 756 seconds re-buying a plan structurally identical to the one it already held); the DOM-id contract scan, which exists because three workers each built a plausible page that could not possibly work together; the CSS-coherence scan, which exists because a journey app shipped completely unstyled while every gate stayed green. Compaction behaviour on a 27B is its own subject — I wrote up what happens when a 27B re-reads its files after compaction separately.
Cost changes what you are willing to run. A local fleet's marginal run is electricity. That is what makes it reasonable to run the same task twenty times and look at the distribution, which is the only way any of the numbers below became trustworthy.
Because someone has to publish what local hardware actually produces. The board's own §01 puts it plainly: existing leaderboards score models on question sets; this one "scores what an agentic system builds: the produced application is executed, probed over HTTP and in a browser, and measured — on the poster's own hardware."
And it is worth being blunt about what the swarm buys, because I have been wrong about this before and the ledger has the retractions to prove it. The campaign's central finding is that extra nodes convert into quality only through deterministic verification machinery, not through raw throughput. A three-node fleet that merely executes a plan faster ships the same defects sooner. Pre-review — the mechanism that uses spare nodes to check in-flight work — was measured at 2.0× per run on one node and 10.2× on three, a 5.1× scaling carried entirely by spare capacity. The judge, by contrast, does not scale with node count at all (~88 verdicts per run at one node against ~78 at three) and is treated as fixed overhead. The defensible claim is that more nodes finish the task; more nodes have not been shown to build a better app. I went through the tuning side of that in making the goose swarm predictable.
Here is what one of those runs costs, from the telemetry the engine records per call and publishes with the entry:
node
calls
prompt tokens
completion tokens
prefill tok/s
decode tok/s
workhorse
525
10,170,294
334,528
351.7
14.0
mihai
227
7,130,769
202,000
2,219.1
12.9
gabee
267
7,788,196
205,387
1,812.4
14.0
fleet
1,019
25,089,259
741,915
1,294.7 (median)
13.9 (median)
5 rows × 6 columnsHeader row enabled
Twenty-five million prompt tokens to build one application. The prefill spread across three machines serving the same identifier — 351.7 against 2,219.1 tokens/sec — is why the scheduler weights dispatch by measured host speed, and why "3-node local fleet" is a weaker specification than it sounds.
The headline capability: the scorer executes the build
Most "did the agent do it" evaluation is a model judging text. This one boots the app.
The current task, sb-7, is documented in full on the methodology page. The entrant receives a frozen specification of roughly 8,200 words and builds the Meridian Payments Console: two cooperating Python-stdlib services (ledgerd and notifierd) that sync 12,288 payments from a mock vendor API, keep them consistent through vendor-pushed webhooks, concurrent edits, SIGKILLs and partitions, run a maker/checker approval workflow that creates real vendor payments, and serve a finance team a live console — payments table, notifications feed, and an interactive raw-WebGL 3D field rendering every payment as an instanced column. No libraries. Four frontend files, 150 KB combined, zero external code.
The scorer then runs that. It boots both services on free ports, waits for them to report healthy inside the spec's ten-second budget, drives a full sync while the vendor commits scripted mutations mid-walk and delivers signed webhooks in a race whose order is part of the schedule, drives a headless browser through six scenarios (load, sync, the approval flow, the 3D field, the error state and a cold boot), SIGKILLs the process group and respawns against the same database to count what survived — and grades the vendor-side trace, not the source code, for whether the client honoured the contract.
That last part is the design idea worth stealing. From the mock vendor's founding docstring — the doctrine the v3 vendor that sb-7 uses carries forward verbatim:
Every request is appended to a JSONL trace. That trace, not the produced source code, is the evidence for whether a client honoured the documented contract: you cannot fake having sent If-None-Match, and you cannot fake having waited for Retry-After. […] Nothing is a trick: a careful engineer who reads the docs gets every one of them right, which is the fairness bar the benchmark holds itself to.
The other thing that makes it hard to game: the fixtures and the fault schedule are derived from a per-run seed, so a memorised constant is worth nothing. I checked this on this machine rather than taking the docstring's word for it. The modules are pure, so from evals/swarm-bench/bench/ you can import them and look:
The structure is frozen — 12,288 payments, fixed server-side pages of 64, therefore 192 pages, and an optimal walk of 194 requests once you account for the one dropped connection and the one Retry-After retry the schedule injects. The positions move every run. An app that hardcodes "the connection drops after page 81" passes once and fails forever after.
And every check that can end a run carries the harm it stands for as a string in the source, not as a sentiment in a design doc. The twelve that matter most are in the next section, with their consequences quoted exactly as the scorer stores them.
How a score gets built
Keep this arithmetic, because it is the whole instrument.
Graded in [0,1], never binary — a pass/fail sheet collapses "returned 3 of 47 payments" and "46 of 47" into the same miss.
Checks are graded in [0,1], never binary. The justification has sat at the top of the harness's first scorer since the beginning: "'Kinda works' must be easy to reach; the distance from there to excellent is what the instrument has to resolve. A binary sheet cannot express that — it collapses 'returned 3 of 47 payments' and 'returned 46 of 47' into the same MISS." So c_paged_walk scores min(served / 192, 1.0) for the walk, times a penalty for undocumented query parameters, times a penalty for pages served twice. b_chronological_order scores the fraction of adjacent pairs ordered by parsed instant rather than by string. Nothing is a pass/fail box.
The same docstring carries the design decision that explains why nobody on the current board is marked excellent: "100 is not meant to be reachable. A perfect score means the task has stopped measuring […] If something ever does reach 100, that is the signal to deepen the task, not to celebrate."
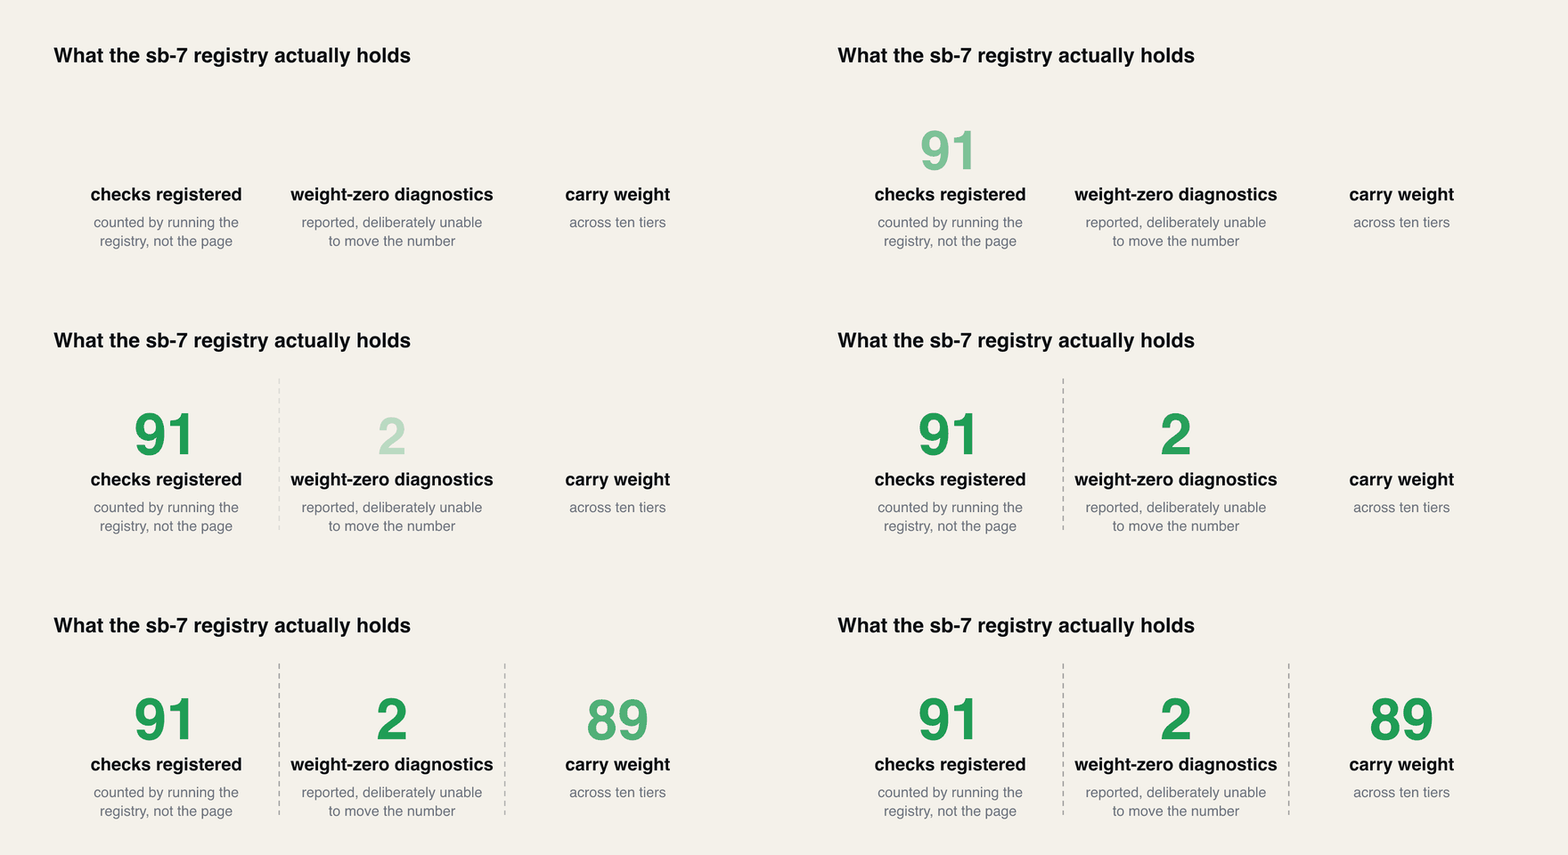
sb-7 registers 91 checks. I ran the registry here rather than counting them on the page:
Two of the 91 are weight-zero diagnostics — computed, reported, and deliberately unable to move the number, because they are already absorbed by compound checks and paying for them twice would be double-counting. The remaining 89 carry weight across ten tiers:
text
1A 0.04  boot & deliverables        T 0.14  the 3D field
2B 0.09  wire behaviour             X 0.16  consistency ledger
3C 0.09  sync discipline            R 0.16  resilience
4D 0.06  validation & docs
5J 0.12  journeys                   E 0.12  excellence (separate slice)
6V 0.06  rendered truth
7P 0.08  performance
inner is the weighted mean of the ten tier means. The excellence slice is separate and unlocks in proportion to sixteen named perfection conditions, then pays out at the excellence tier's own measured mean. Two asserts in the source stop anyone quietly compressing the hard half of the instrument back out again:
Any future edit that re-compresses the ruler has to delete an assert to do it, and the diff will say so out loud.
Then the part that produced this article's hero image. Twelve checks are registered CRITICAL — each one a consequence a correct app provably avoids — and each contributes a multiplier factor = m + (1−m) × severity, with m = 0.6, compounding. The twelve, with the consequences the source assigns them:
check
consequence
server_runs
crash — the tool does not run
sync_completeness
data loss — silently missing payments
b_money_rendered
wrong money — wrong exponent/digits or a cross-currency sum
b_buckets_dst
wrong money — mis-bucketed days
x_conservation_residual
wrong money — unexplained minor units created/destroyed after dupe/loss attribution
x_no_lost_write
wrong money — an acknowledged mutation absent from final state
r_no_row_loss
data loss — a committed row missing after any seeded kill
r_no_dupe_effect
wrong money — a ledger effect applied twice
r_cache_truth
data loss — 304-vs-cache mismatch served as fresh
r_workflow_durability
data loss — submitted/approved state reverting after SIGKILL
j_loads_data
dead primary flow — no data visible
j_workflow_journey
dead primary flow — approval cannot complete through the UI
13 rows × 2 columnsHeader row enabled
I measured what that costs by pushing synthetic rows through the real composition function on this machine — start from a hypothetical build with all 91 checks at 1.0, break exactly one thing, and read the score back:
what broke
score
nothing
1.0000
a cosmetic styling check halved
0.9947
a minor content-type check halved
0.9947
one console error (with first-use degraded, as the selftest builds it)
0.9835
stale cache served as fresh
0.5916
a ledger effect applied twice
0.5916
wrong money — a cross-currency total
0.5957
a committed row lost after a kill
0.5871
dead primary flow — no data visible
0.5864
10 rows × 2 columnsHeader row enabled
There is no gentle slope between "your styling is bland" and "you lost someone's money". That is deliberate, and it is what the multiplier is for.
Now the fleet's own entry, which is public with all 91 check rows. Its backend is genuinely not bad — sync_completeness scores 1.00, its detail reading 12290/12288 payments after the self-driven full sync; the two services boot; the app survives four SIGKILLs with no rows lost; and the approval state survives a kill. Tier means as posted: structure 0.72, wire behaviour 0.51, sync discipline 0.74, validation 0.71. Pre-severity, that composes to 0.3680:
Then six of the twelve criticals fire — money rendered with the wrong exponent, day buckets mis-computed across the DST transition, no data visible in the console, the approval journey unable to complete through the UI, and two conservation checks finding minor units created or lost:
text
10.6 ** 6 = 0.046656 0.3680 × 0.046656 = 0.0172
An app that mishandles money and cannot finish its own workflow should not score well, however much else works. The run card prints that arithmetic itself, so you can check me rather than believe me.
Why you should believe the ruler
Fair question, and the fairest version of it is this: the benchmark is written by the same project whose swarm it grades, and it is our own fleet's scores it publishes. That is a real conflict of interest and there is no way to argue it away. What there is, is the machinery that exists precisely because of it, and it is all in the repository.
Before any score is believed, the grader is proved in both directions. From controls.py, quoted at the top of the file:
HIGH a known-good build scores high / LOW a deliberately broken build scores low / ISOLATION each injected defect fails ONLY its own check.
Isolation is the one that matters most and is almost never checked. A grader with a shared precondition collapses a mostly-correct build to zero — measured twice in this project, once when a missing subcommand took a 43/45 build to 0/44, and once when a stale trace field scored a correct paginator 0%. Both looked like devastating model failures and were neither.
Defects are injected into a copy of a real known-good tree, not a hand-written strawman, so the control tests the grader against the same shape of artifact it will grade in production. Determinism is a third control: the same tree scored twice must produce an identical per-check vector, or the run is stamped GRADER NOT TRUSTED.
sb-7 adds one more, and it is the one I would copy into any scoring system with a severity model. The freeze gate runs a monotonicity selftest — synthetic single-defect row sets pushed through the real composition function, not through a re-typed copy of it — and any inversion refuses the freeze. It is wired into --reference, and it is cheap enough that there is no excuse not to run it. On this machine, over the full 91-check registry:
text
1severity_selftest ran in 0.004s -> 0 failures
Be precise about what it proves, because I checked the asserts rather than the prose around them. It proves that every consequence class costs strictly more than a console error, and that a console error costs more than a cosmetic or a minor defect. It does not enforce an ordering within the critical classes — and measured above, wrong money, data loss and dead flow land within a hundredth of each other, because once any one critical multiplier fires it dominates everything the tiers were arguing about. If you build a severity model, that is the shape to expect: a cliff, not a ranking.
One honest caveat, since I would rather you hear it from me. The sb-7 thresholds file in the repository is marked "calibrated": false, and its three global shaping knobs (gamma_core, gamma_hard, k_p) all sit at identity 1.0. Nothing on that board has been tuned by a calibration fit; the budgets in it are the ones printed in the spec. The mechanism for freezing them is built and armed — a thresholds file claiming calibrated: true whose sha256 does not match the pin baked into the scorer makes it refuse to score at all, a structural refusal rather than a silent default — but the freeze has not landed, and until it does the scorer stamps its own output sb-7.0-rc.
What the benchmark caught in itself
Two stories, both of which have happened to you if you have ever written a test harness.
Rendered means seen. A run scored 0.9528 and "excellent" on an application that showed every user "Backend unreachable". The app loaded all 247 payments of that era's task, appended its rows, threw on an undefined identifier in the same render pass, and painted the error state over a display:none table. Every row counter in the browser probe read the raw DOM, so hidden rows counted as rendered. I found it by looking at the screenshots — not one gate caught it. The fix is four lines: count dataRows() filtered by visibility, and ship the raw DOM count alongside as a diagnostic so the gap itself is measurable. The commit's closing line is the editorial policy in one sentence:
Re-scored run 9's shipped tree under sb-5.3: 0.8911, excellent=False, V 0.55 / J 0.80 […] The 0.9528 row is not publishable and will not be published.
Three failures in one bug, and they are worth separating: a scoring bug (the score inflated), a repair bug (the engine's render gate shares that probe, so no fix round was ever aimed at the frontend), and a reporting bug (the word "excellent" flipped on). The engine's fix rounds had worked precisely the findings the gates named. The one defect a human could see was on no list. That is the same family as pytest piped to head exiting 0, which this same engine produced and which I wrote up separately — a false green is almost never a lie the model told you.
The ruler moves more than the entrants. One archived Claude Opus 5 tree, unchanged, has carried three published numbers as the instrument was repaired: 0.7445 → 0.8281 → 0.9307. The middle step came from scoring serially on a quiet machine at each tree's own advertised vendor port; the per-check diff is what proved it, because none of the checks that moved were the probe fixes — all of them were vendor-interaction timing. Webhook delivery races and stall-trap windows under parallel load had been reading as app defects. The policy since: scoring is serial, always. The third step came from fixing three composition defects, chief among them an all-or-nothing excellence gate that was locked shut on all seven entrants, multiplying the whole board by 0.88.
And when the severity model shipped, the same trees moved again without a byte of the apps changing: on sb-6, a GPT-5.6 Terra entry went from 0.7707 to 0.3252 and our own fleet from 0.5059 to 0.1837. Terra is the model working exactly as intended — a flawless backend whose frontend renders zero rows, now priced as the dead product a user experiences rather than the good API a curl would see.
That is the argument for the era selector, and for the ban on cross-era comparison. On this project, the largest measured effect has at times been the benchmark itself.
What it can't tell you
Single runs, wide distribution. The scorer's determinism is proven; the swarm's is not. Eight one-node replicates on one binary, same scorer, scored 0.1867 to 0.8283 with a mean of 0.5337 — and that spread has a host signature: the fastest machine carried both top rows and the slowest owned both of the ~0.19 ones. Pooled score standard deviation across the campaign corpus is 0.1767, which puts the minimum detectable effect well above the gaps anyone actually argues about. Every single-run number on the board, including ours, is one draw. Where a difference sits inside one standard error the supported statement is "not measurable", never "losing" — I have said the stronger thing before and had to retract it.
"3-node local fleet" is not a reproducible spec. Two quantisations across three Macs behind one model string, as measured above. On the single-node arm the host measurably decides the score. If you care about how much a quant choice moves a local model, that is its own investigation and not one this board answers.
The older fleet entry is not stock Qwen. The 0.0154 row runs qwen3.6-27b-fable-fusion-711, a community fine-tune/quant merge. I have not researched its provenance and will not characterise it beyond its identifier.
Self-reported. The API enforces payload shape, consistency limits and rate limits, but it cannot verify that a payload came from a genuine run.
Some checks are proxies, and the source says which.v_styling scores 0.3 × has-a-stylesheet + 0.25 × at-least-three-distinct-background-colours + 0.25 × the-body-font-is-not-Times + 0.2 × a-branded-header. That is a proxy for design, and publishing the formula is the only honest way to use one.
91 checks is not 91 independent measurements. A ROOT_BLOCKS table in the scorer states which checks are downstream of which — a dead sync zeroes a family — and the report prints ⚠ N further check(s) are downstream of <root> (<1.0) — ONE defect, not N+1, because misreading a blocked family as breadth once cost a week of misdirected engineering.
One posted field on that run card is wrong and I would rather flag it than let you find it. The wallSecs on the qwen3.8 entry is 0, so the card reads "Wall clock 0 min". The run's own notes carry the real figure: 9.6 hours, uncapped, 44 of 48 planned tasks completed, with three lost to a repeated mid-stream transport drop on one node.
Go and look
Three places. Everything above is checkable from them, apart from the two things I measured on my own machine — and those you can reproduce on yours.
1
The board
leanzero.net/agentic-benchmarks. Pick the scorer era from the selector. Every row links to a card with per-check evidence and screenshots of the built application; the sb-5.3 fleet card at 0.9300 and the sb-7.0 one at 0.0172 are the two to read side by side, remembering they are different tasks on different instruments.
2
The method
the methodology page. The frozen spec, the exact composition, and all 91 checks documented individually, generated from the scorer's source.
3
The code
github.com/leanzero-srl/goose-local-edition. The scorer, the controls and the mock vendor are all under evals/swarm-bench/bench/, and the campaign that produced them is in evals/swarm-bench/nodeloop/FINDINGS.md.
One practical note so nobody wastes an evening: results are posted by the desktop app over the site's API, and there is no submission form and no review queue. The public POST route is still on the sb-5.x contract — I read it while writing this, and it rejects any check row whose tier is not one of A|B|C|D|J|V|P, which is every T, X, R and E row sb-7 produces. Do not plan on posting an sb-7 run today.
Key takeaways
Grade in [0,1], never binary — "3 of 47 rows" and "46 of 47" are not the same result, and a pass count cannot say so.
Make every deduction name the harm it stands for. If you cannot name the harm, delete the check.
Prove the grader in both directions before you believe a score: a known-good build must score high, an injected defect must break only its own check, and the same tree scored twice must produce an identical vector.
Derive fixtures and fault positions from a per-run seed. Frozen structure with moving positions is what stops a memorised constant passing for competence.
Severity is not a weighting — it is a multiplier. One wrong-money defect should cost more than every cosmetic check combined, and a selftest that pushes synthetic single-defect rows through the real composition is cheap enough that there is no reason to ship without one.
When your instrument changes, your old numbers belong to the old instrument. Publish them in their own era and refuse the cross-era comparison, even when it flatters you.
Goose Swarm 3.0: local models on every Mac, joined by LeanZero Link
Goose Swarm 3.0 is our local-first build of the goose agent: an MLX engine inside the app, a router that spreads chat turns across local and cloud nodes, LeanZero Link to put your other Mac to work, recurring Agent Work desks, memory that recalls itself, and an OpenAI-compatible endpoint. I installed it on a Mac Studio and went through all of it, including the parts that did not work first time.