Runs on Atlassian. The app runs entirely on Atlassian Forge and declares no connection to any outside service. Everything it keeps is in its Forge storage or in Jira on your own site, where it holds a backup of its setup, and its AI features call Atlassian-hosted models through Forge LLM. The app itself sends no issue, date or plan off the Atlassian platform; only a person can take a copy out, by downloading or copying it, or over the REST API.
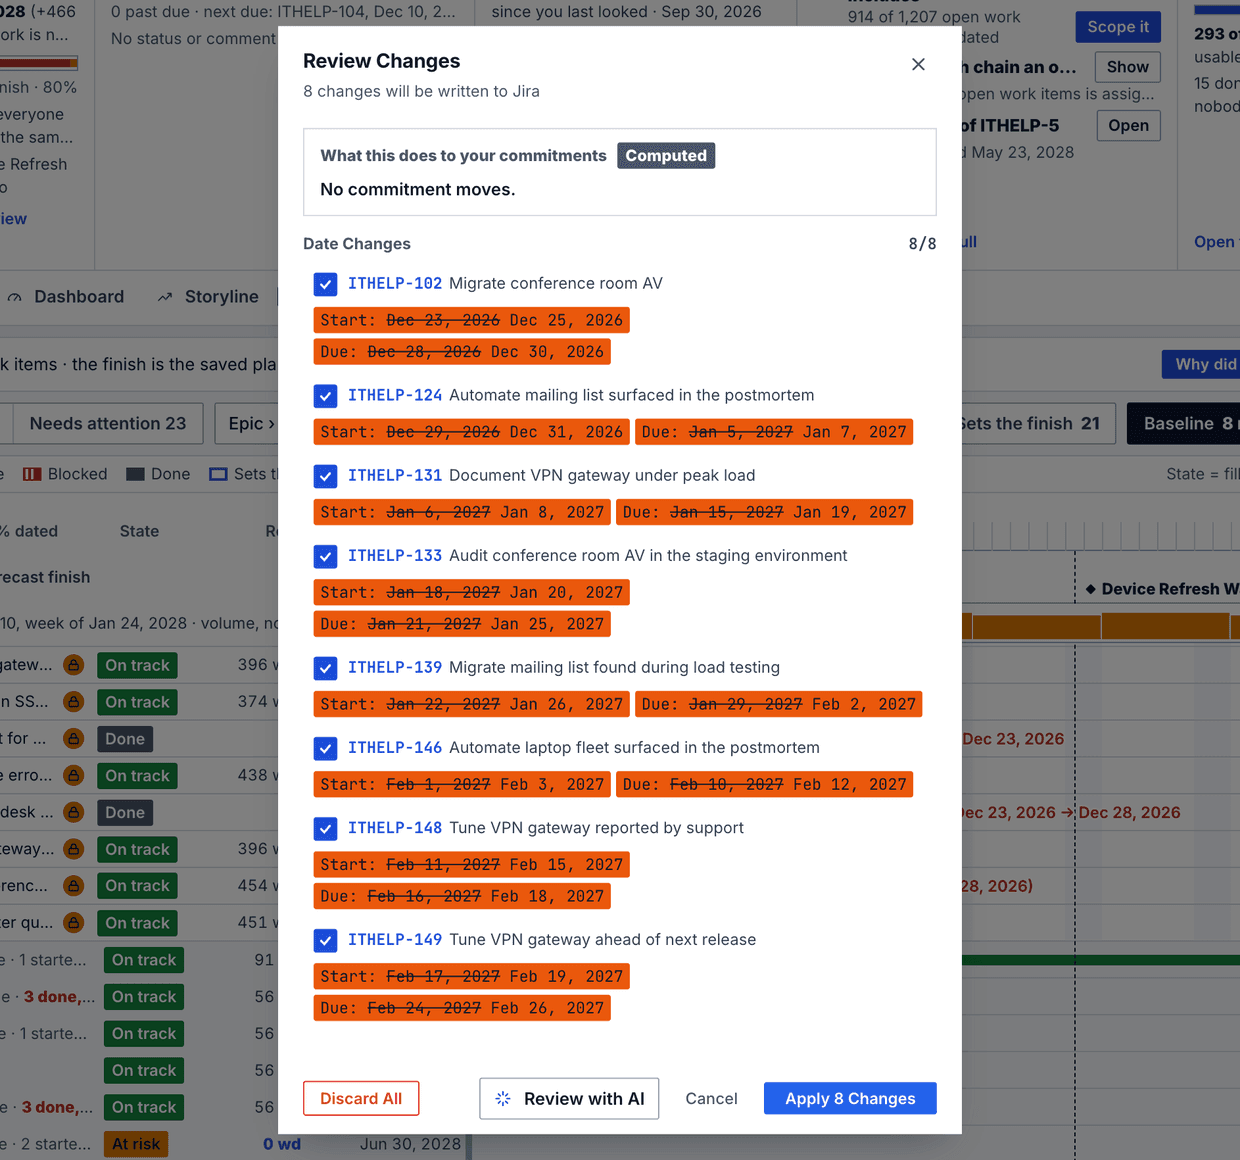
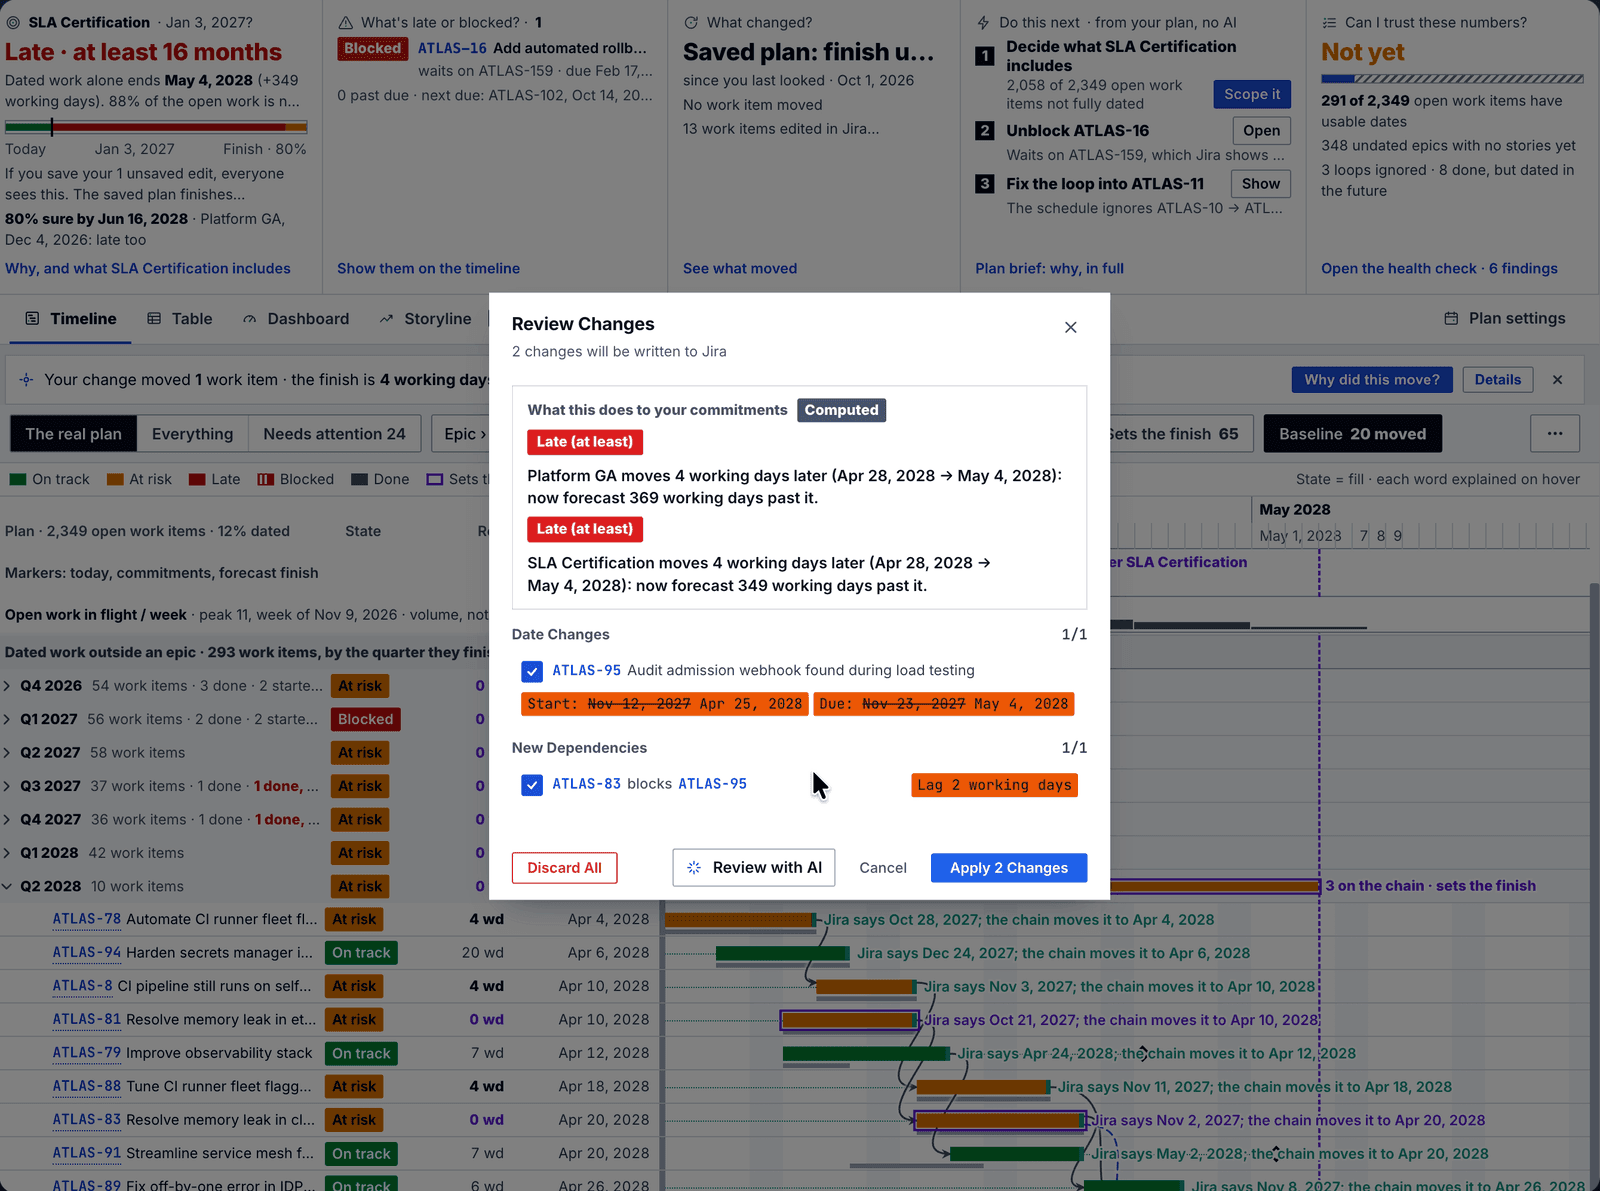
No plan edit is written to Jira until you approve it. Edits stay in your draft. Apply opens a review that says first what the change does to your commitments, then lists every date, dependency and rank change beside its old value. Untick a row and that issue is left alone.
A plan that reschedules itself, inside Jira
Most roadmap views draw bars. They do not reschedule. When a task slips, somebody works out by hand what moves and edits a dozen issues. LeanZero Management puts a scheduling engine behind the bars: move one task and everything that depends on it moves, on your working calendar, across as many Jira projects as the plan holds.
Successors wait for every predecessor
A task with three predecessors starts the working day after the last of them finishes, plus any lag on the link. Merge points are where most roadmap tools quietly get the date wrong.
Working days, never raw calendar days
Weekends and plan holidays come out of the arithmetic. A due date on a non-working day stays put, and the work it blocks starts the next working day.
Buffers absorb slip instead of passing it on
A buffer task holds its due date while its duration shrinks, so upstream overruns are consumed before your delivery dates move.
Parents span their children
An epic always spans the work under it, on the Timeline and in what Apply writes. A Done ticket is never moved by a schedule change.
17 tutorials
Watch it work: 17 tutorials
Every feature recorded on a real Jira site, in the order of this page. Start with the five-minute compilation at the top of the page, or jump to the feature you need.
Jira Issue Panel: Where a Ticket Sits in Your Plan
Add the LeanZero Management issue panel to a Jira ticket and see where it sits in the plan: what it waits on, and what waits on it.
5 answers on every tab
Five answers the moment you open a plan
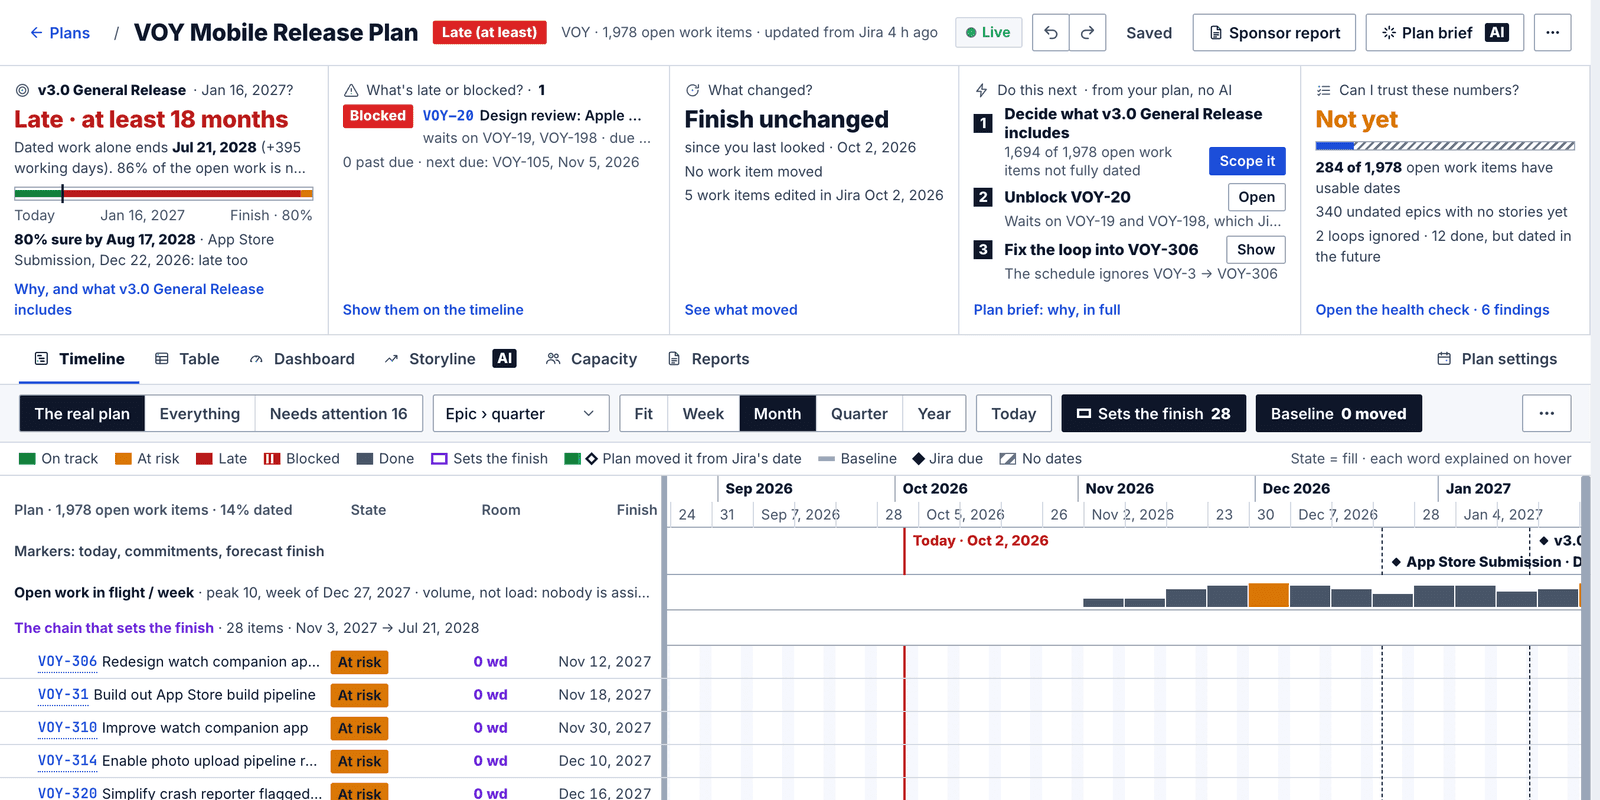
The top of every plan answers the questions a sponsor asks first. Each answer is one short line that opens the facts behind it.
Will we hit the date?
The plan's status against its commitment, with the room left in working days and the chance of making it from the forecast.
What is late or blocked?
Past-due and blocked work, each naming what waits on it. One click shows them on the Timeline.
What changed?
Whether the finish moved since you last looked, which items slipped, and what was edited in Jira.
What do I do next?
Up to three next moves taken from the plan itself, with no AI: scope a target, unblock an item, fix a dependency loop.
Can I trust these numbers?
How much of the open work has usable dates. When less than 80% is dated, the plan reads Late (at least) or Can't tell yet instead of On track.
The Health check
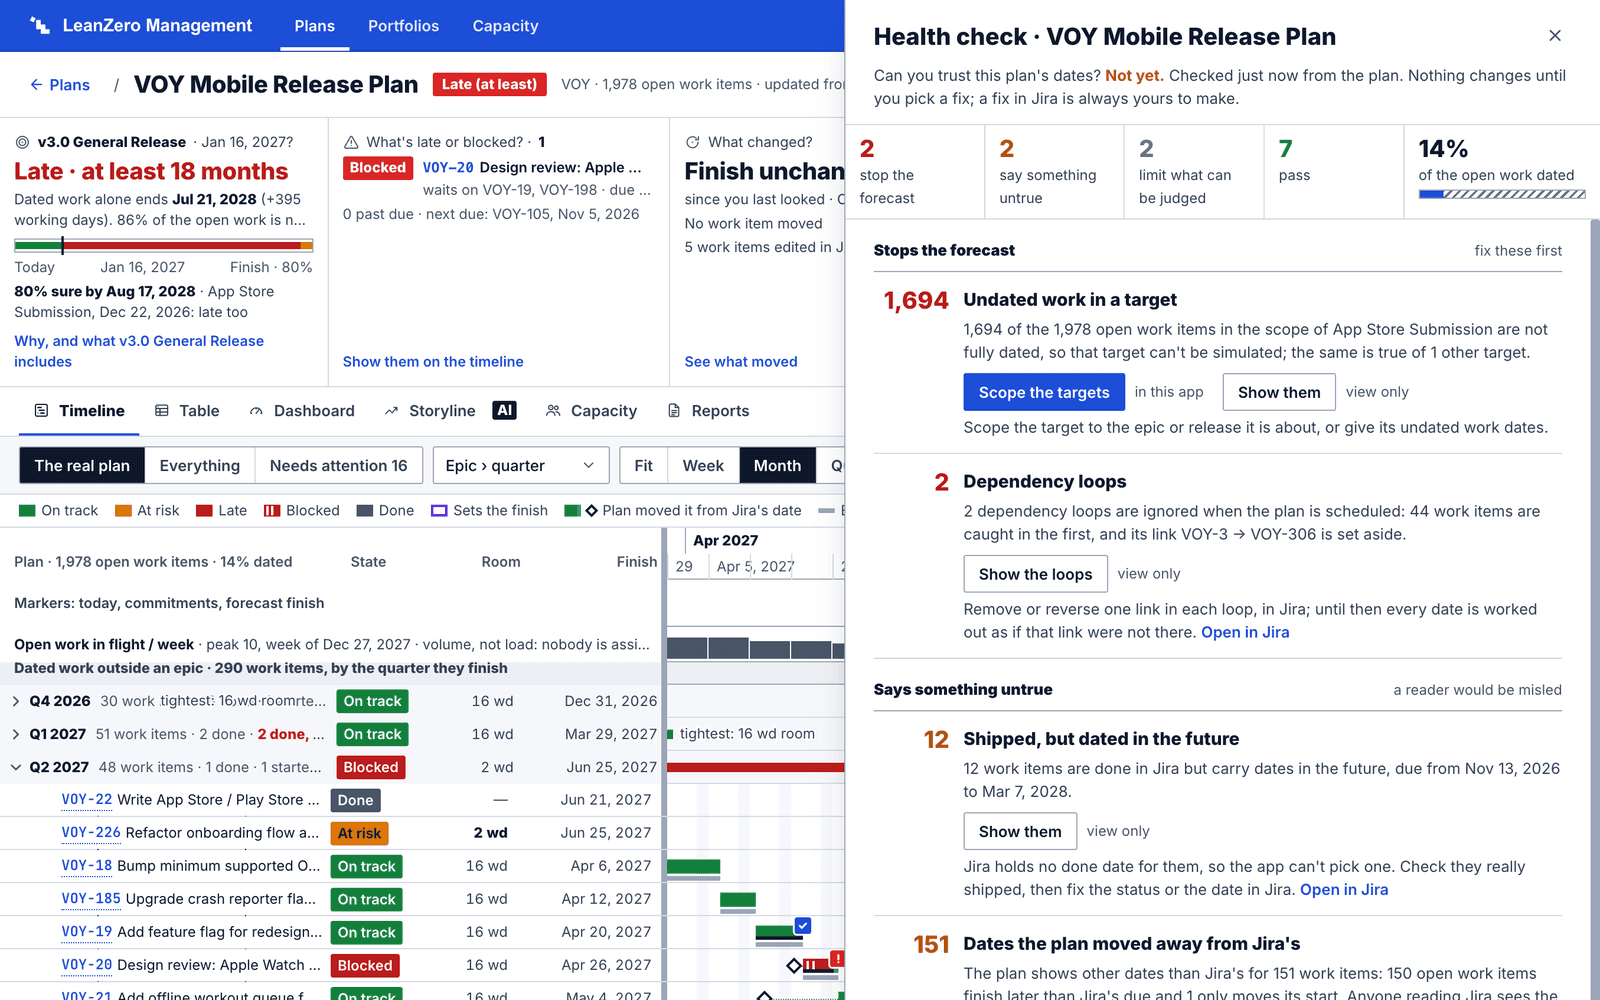
What stops the forecast, what says something untrue and what limits what can be judged, each with a count and the fixes that apply. Nothing on it writes to Jira.
A demo plan with most of its work undated. It does not pretend to be on track: it reads Late (at least), names the blocked item, lists three next moves, and answers Not yet to Can I trust these numbers?The Health check, opened from Can I trust these numbers?. Each finding has a count, a sentence and its fixes; a fix that changes dates opens a review first.
Drag one date, the chain moves, Apply writes it
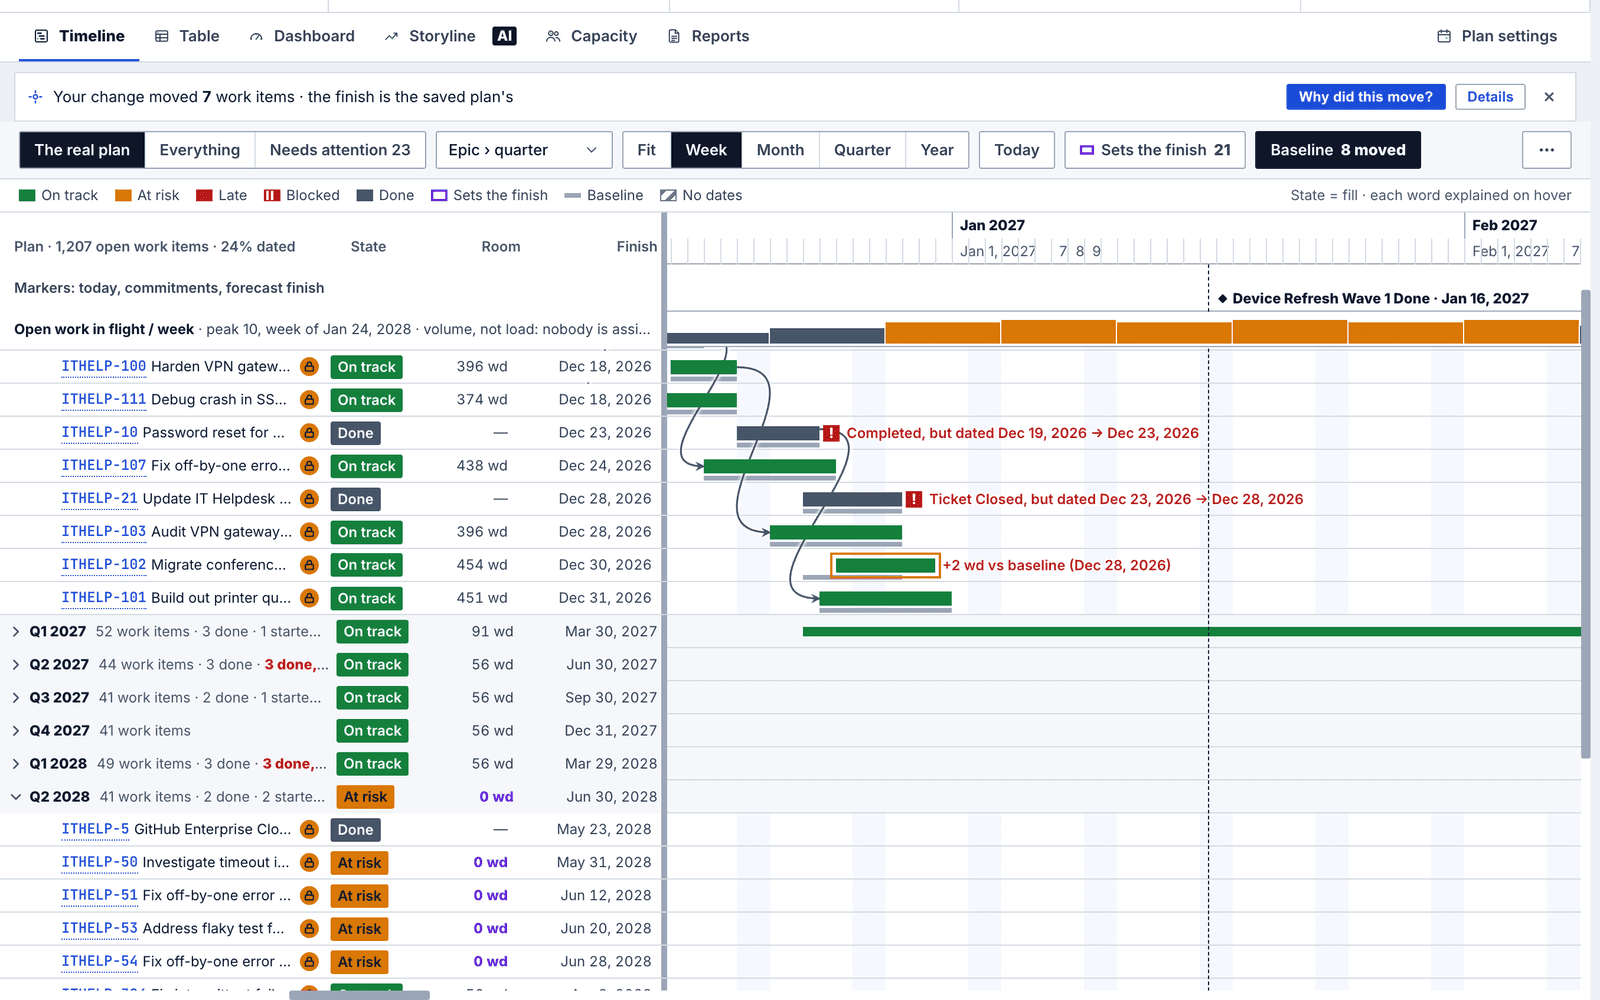
The Timeline opens on The real plan: the epics that hold work, dated work grouped by quarter, and the chain that sets the finish in a lane of its own. Drag a bar and every item that waits on it moves. Undo takes back up to 50 steps until you apply or reload the plan.
One drag on a demo plan: the work that waits on it moves along its links, each bar keeps a line where its baseline was, and the strip above counts what moved. Why did this move? lists each item. Nothing is in Jira yet.
The Apply review after that drag: the effect on your commitments first, then every date it will write, old value struck through. Apply writes new links first, then the dates, and shows progress issue by issue.
Dependency lags, and two planners on one plan
Draw a dependency on the Timeline, give it a lag in working days, and Apply creates the Jira link before it writes any date that relies on it. When two people plan at once, neither can write dates for a link the other has not applied.
Lags in working days
Draw a dependency between two bars and give it a lag. The lag belongs to the Jira link, and the Apply review shows it, for example Lag 2 working days.
A colleague's dates wait for their link
Dates a colleague saved that rely on a dependency they have not applied yet are held back from your Apply, and the review says which link and who staged it.
Keep mine or Take theirs
If a colleague draws the same link with a different lag, Apply asks which lag the link keeps and writes nothing until you choose.
One Apply at a time
A write lock per plan, a conflict check for anything changed in Jira meanwhile, and an Apply that stops partway resumes without sending any issue twice.
A new dependency with a two-day lag in the Apply review, with what it does to each commitment above it.
One set of numbers you can trust
The Plans page, the top of the plan, the Dashboard, the Timeline, the Storyline, the Plan brief and the sponsor report all show the same numbers for a plan. A what-if edit counts only on your own screen until you save it; everyone else keeps seeing the saved plan.
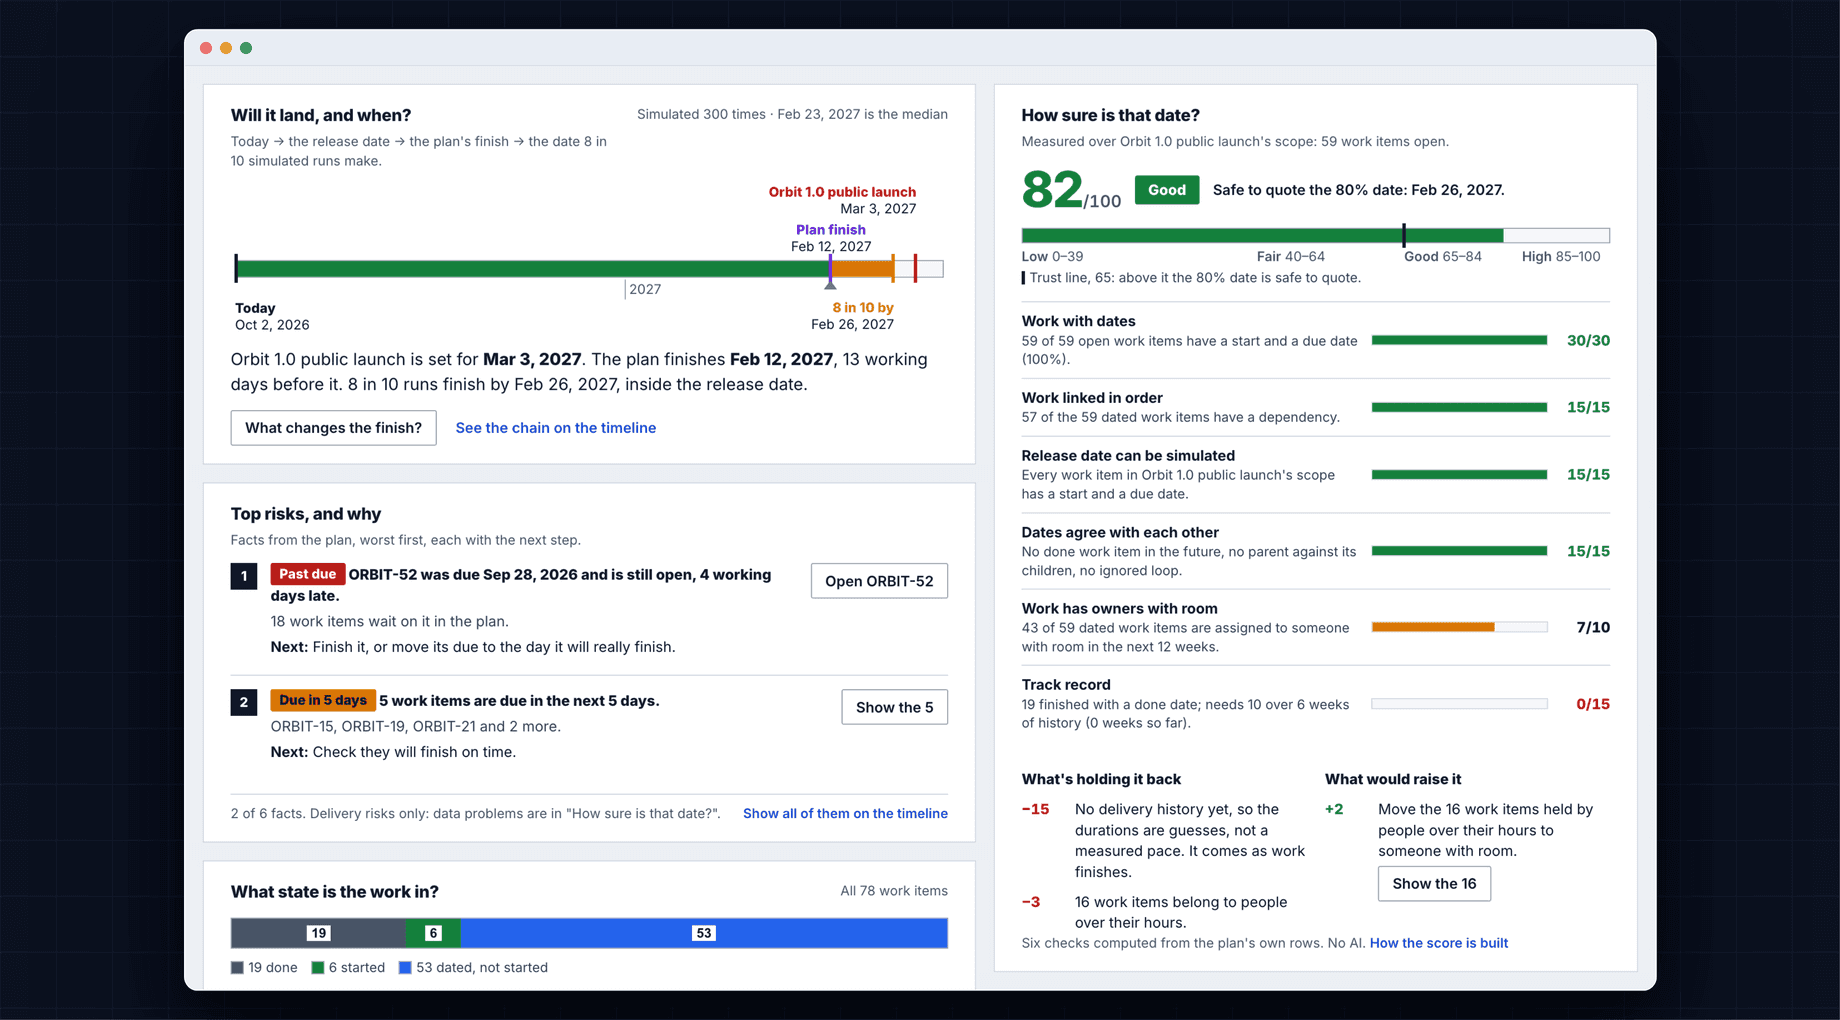
The Dashboard answers will it land and when, and how sure that date is: a score out of 100 from six checks of the plan's own data, each with the count behind its points. No AI is involved.
An editable sponsor report, published to Confluence
Prepare sponsor report opens a draft on the plan's frozen numbers. You add what only you know; everything you write carries a PM tag wherever the report goes.
Your words, the plan's numbers
Write a headline, a note under any line, and decision requests with options, a date and an owner. The verdict, the commitments and the finish cannot be edited.
Internal or external sponsor
An external report hides ticket keys, Jira links, names and quoted comments by default and says so. A check before Send flags a headline that contradicts the plan.
Sealed versions
Every send, as a download, a Confluence page or plain text, seals a numbered version that never changes. The next report carries your edits over where their lines are unchanged.
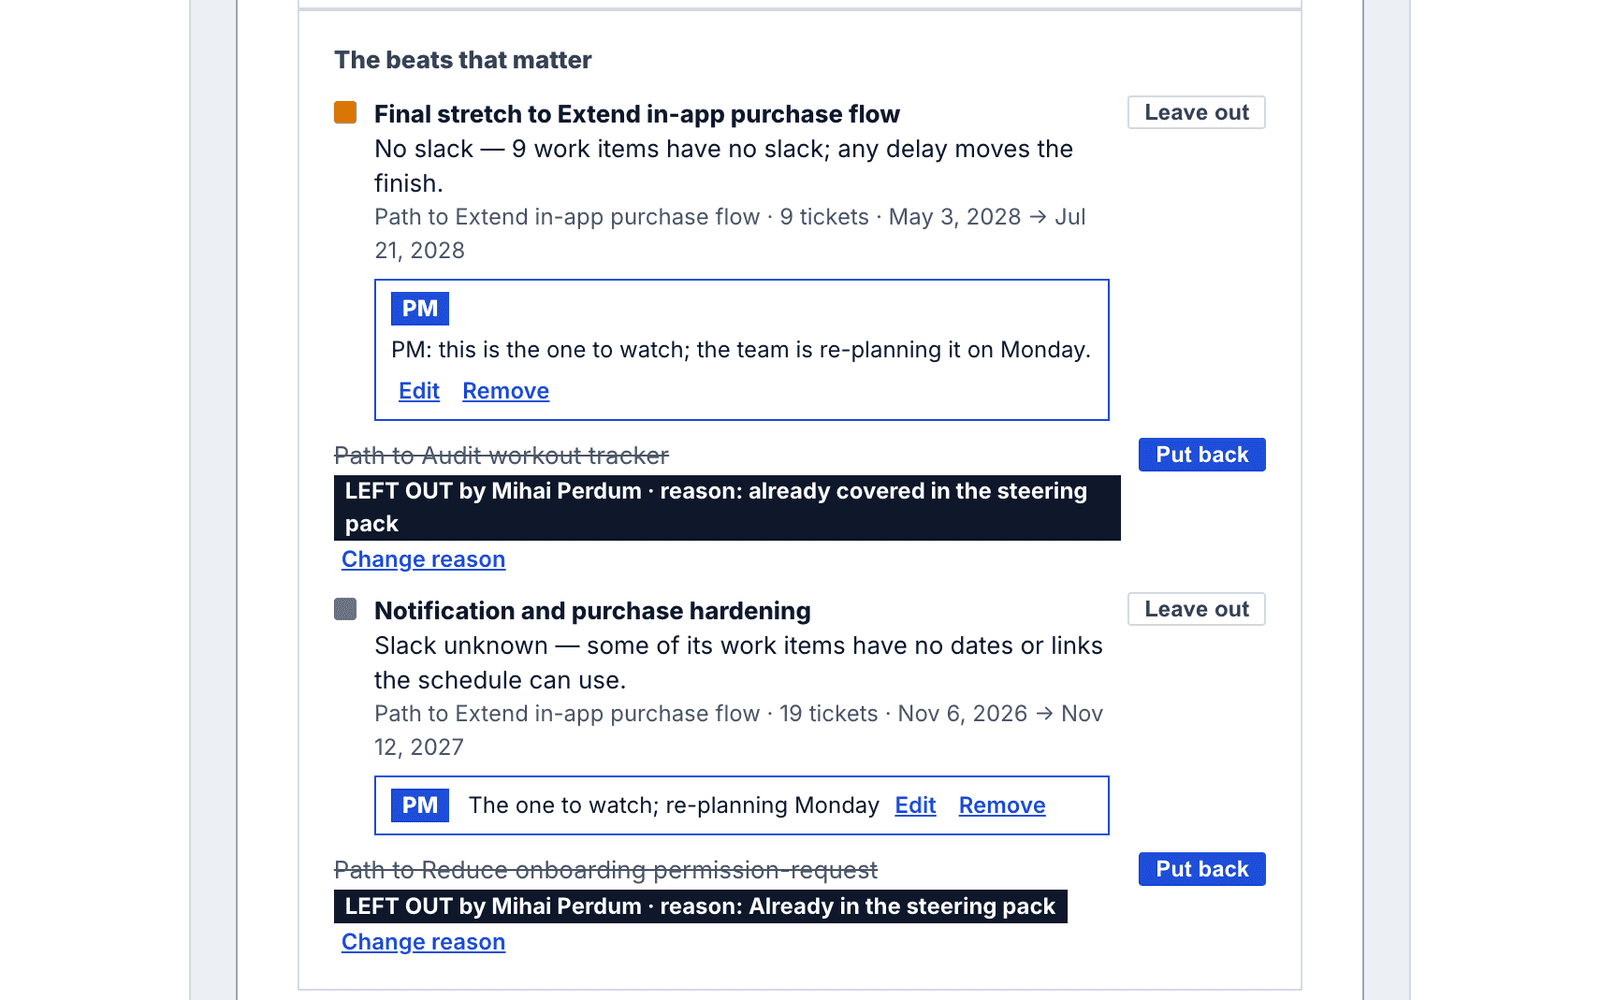
A sponsor report draft: notes from the project manager under the beats that matter, and two lines left out, each saying who left it out and why.
6 features, each with its own switch
AI with guardrails
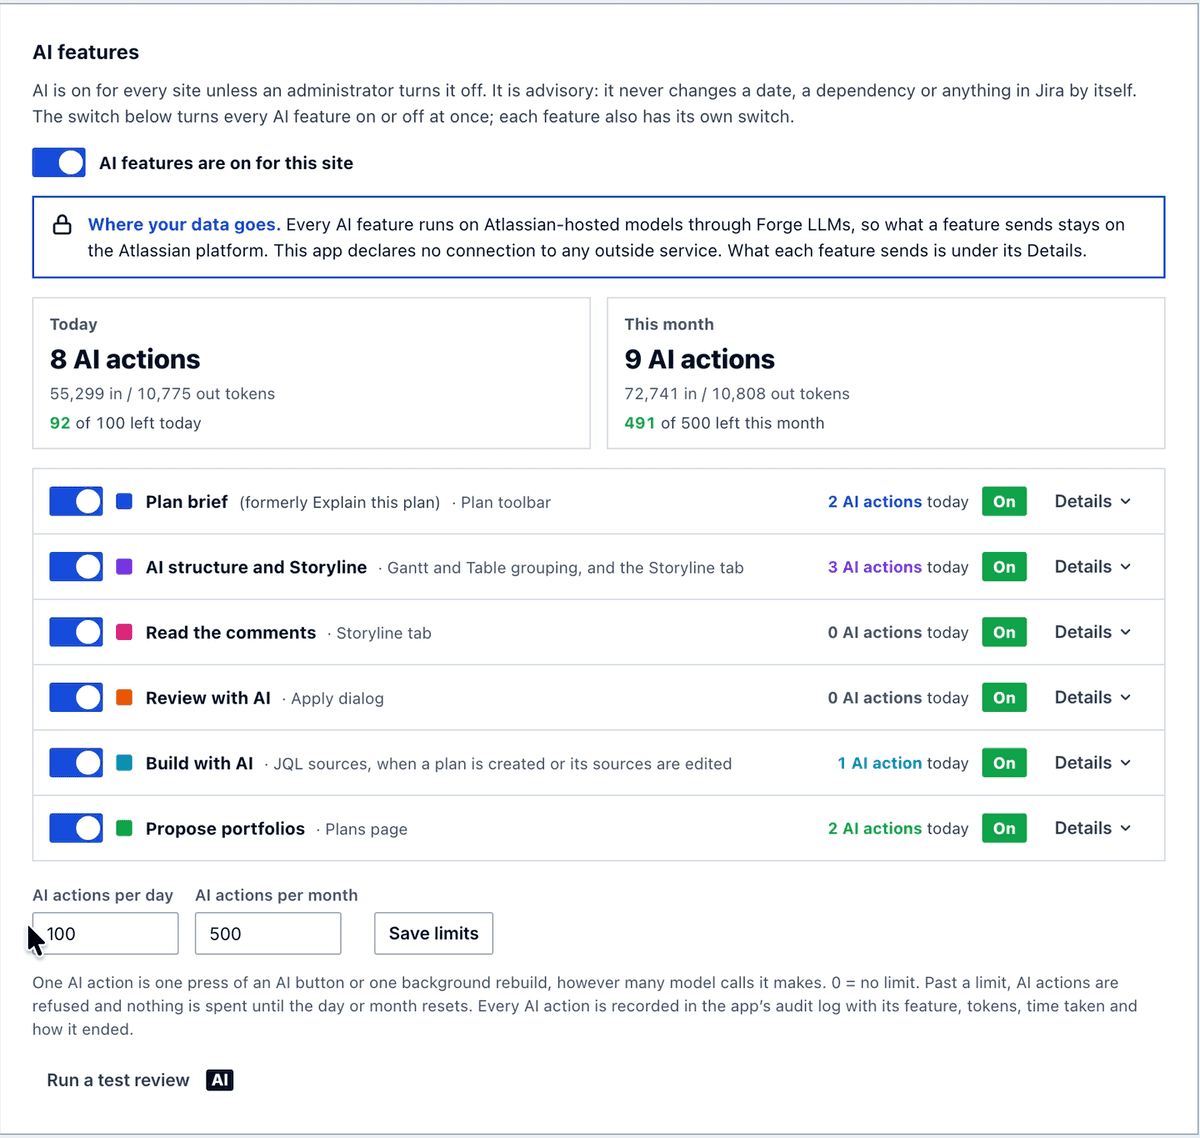
AI is on for every site unless an administrator turns it off, and each feature has its own switch and shares daily and monthly caps. It is advisory: it never changes a date, a dependency or anything in Jira by itself, and it runs on Atlassian-hosted models.
Review with AI
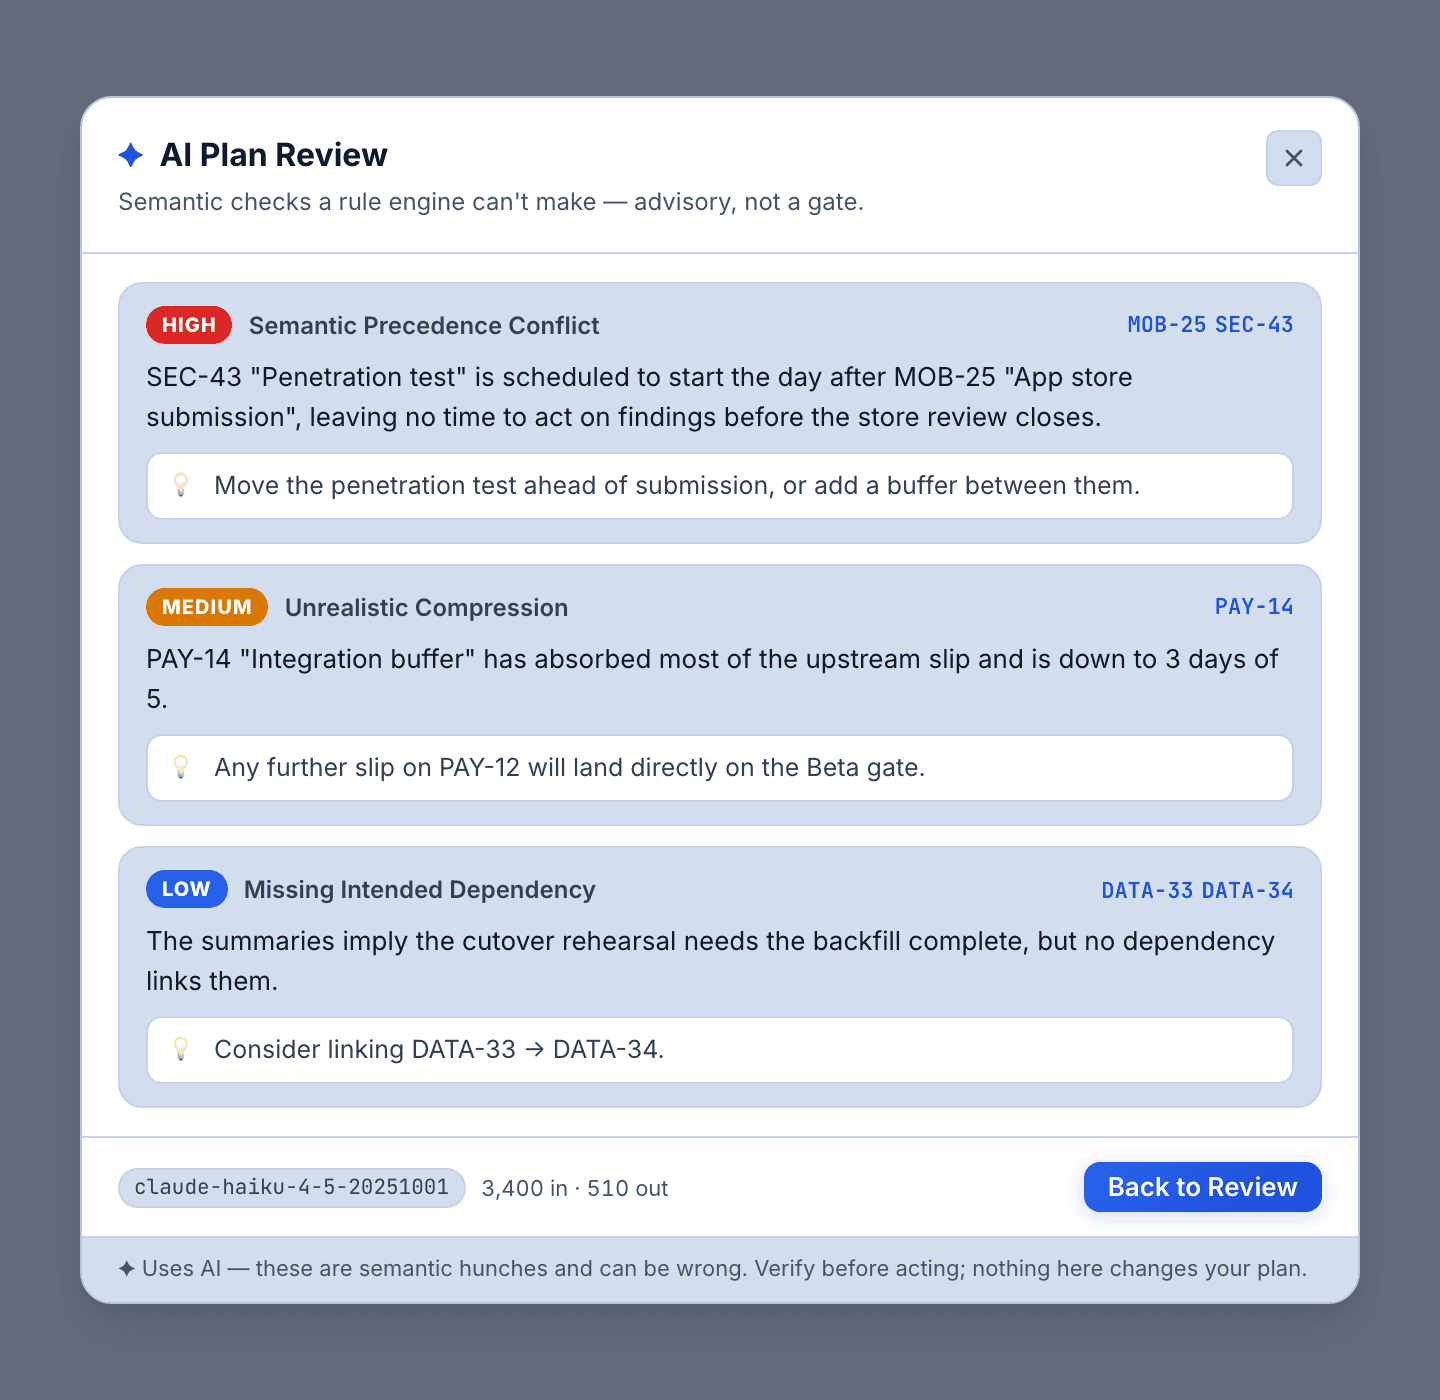
Opens from the Apply review. The app's own checks come first; the AI then reads up to 120 issues, your staged changes first. Findings your plan's dates disprove are dropped.
Plan brief
The one thing to know, the decisions for your sponsor and the next moves, computed by the app. The AI drafts the update, and every sentence it keeps is traced to a computed fact.
Storyline
The AI groups the plan's linked work into a few named chains and puts the one that sets the finish first, with the room each one has left.
Read the comments
Reads the newest comments on the tickets that matter and quotes them word for word. Restricted comments, internal service desk comments and who wrote a comment are never sent.
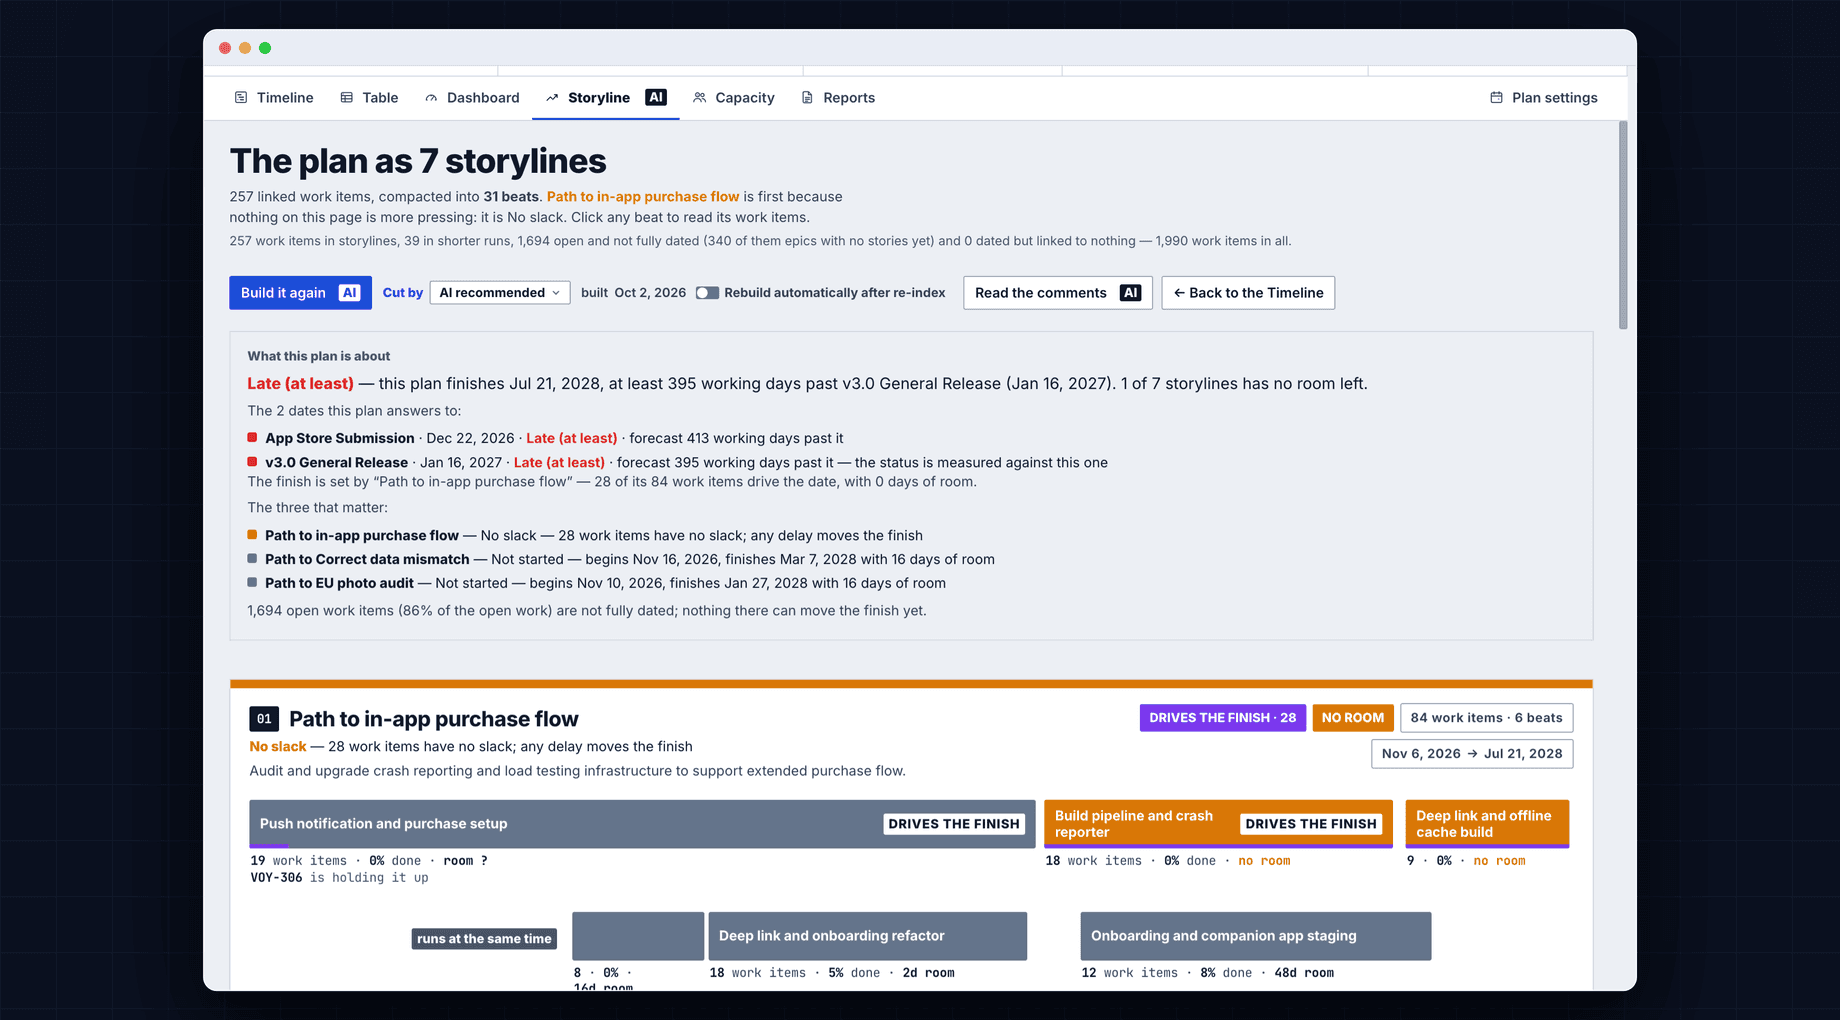
The Storyline: 257 linked work items grouped into seven named chains, the one that sets the finish first.
Review with AI opens with what the app checked itself, then says what the AI read and what it found. When it finds nothing, it says so.
Every plan on one page
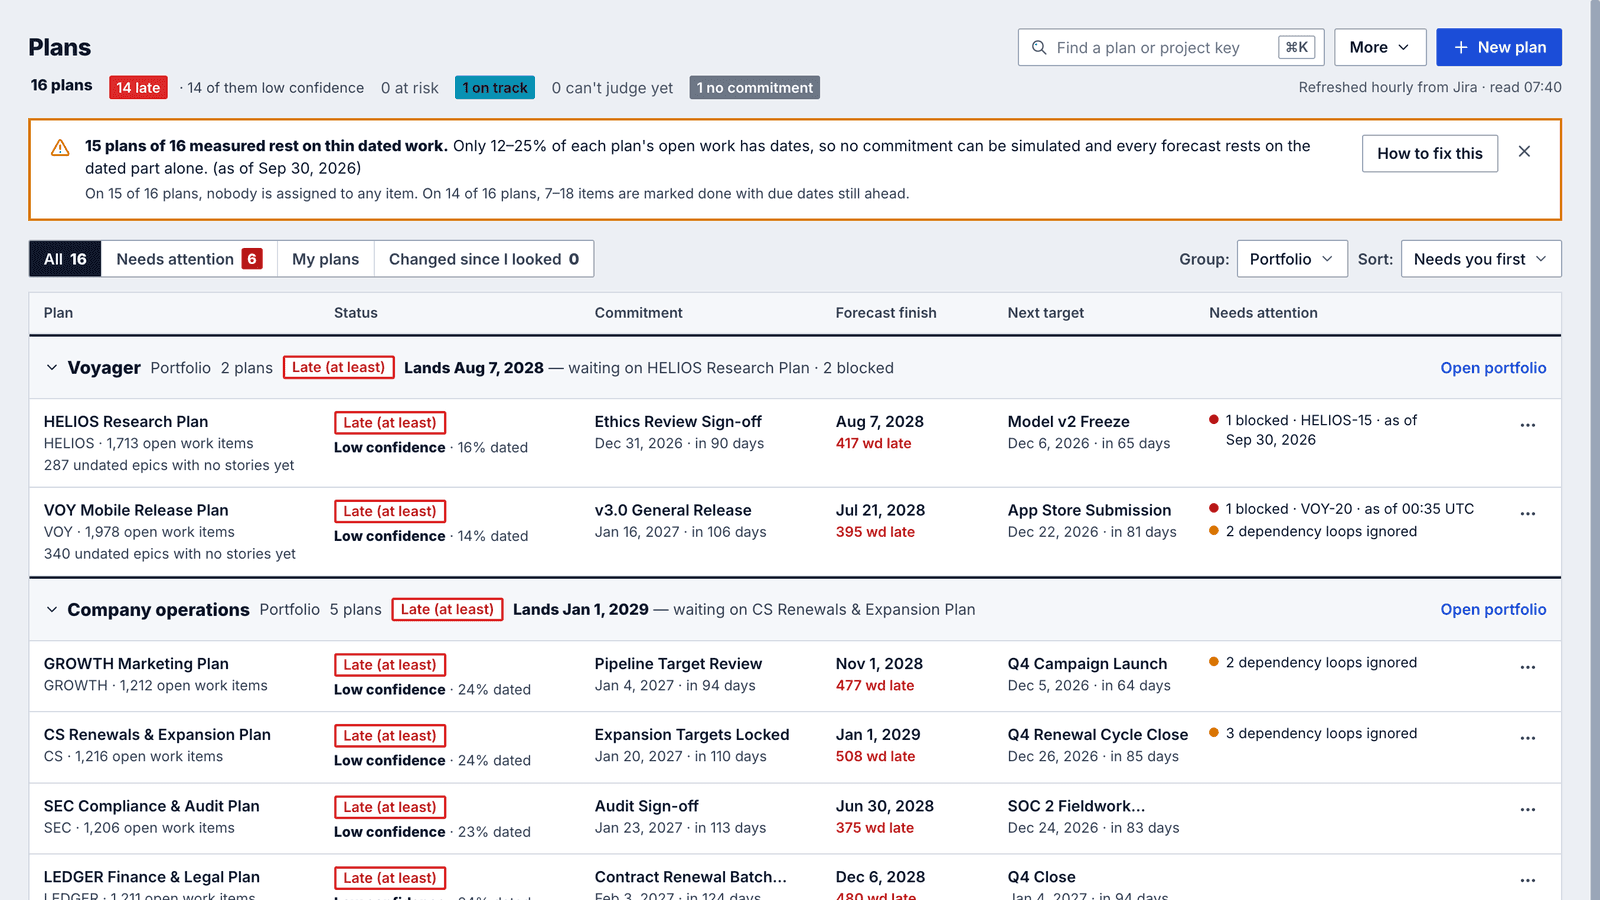
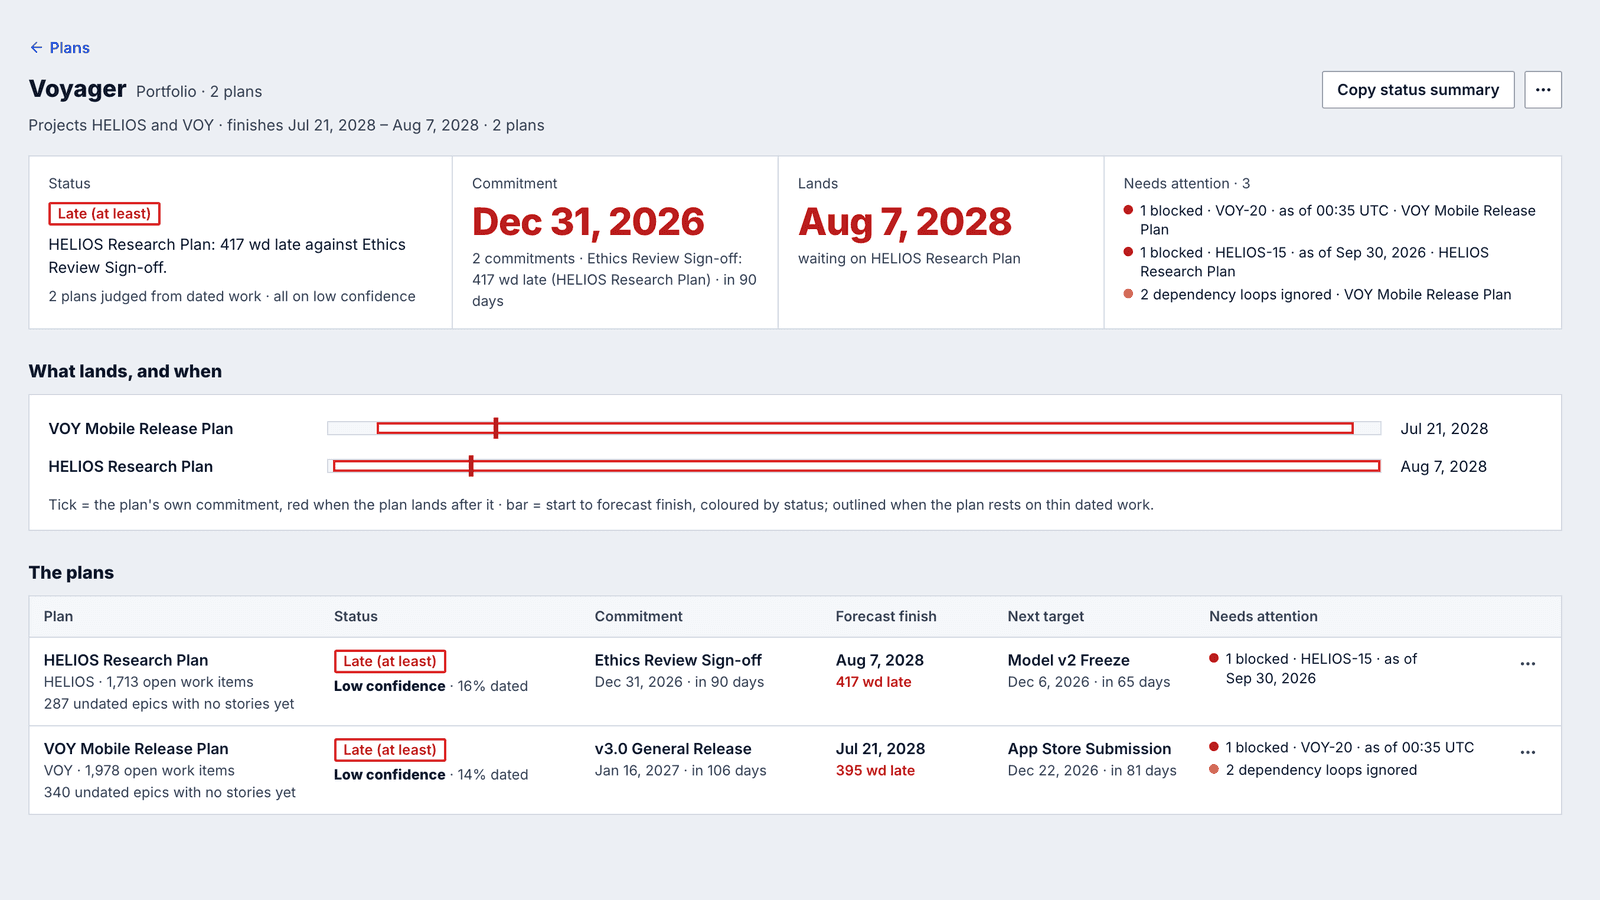
The Plans page is one table, sorted with the plans that need you first: status, commitment, forecast finish, next target and what needs attention. When most plans share one problem it is said once, at the top. A portfolio's page says its status, commitment, when it lands and what needs a person, with a status summary you can paste into an email.
The Plans page on a demo site with sixteen plans, grouped by portfolio. The banner says once what most of them share: too little of their work has dates.A portfolio page: a bar per plan from start to forecast finish, with that plan's own commitment marked, in red when it lands after it.
Baselines, and what moved since
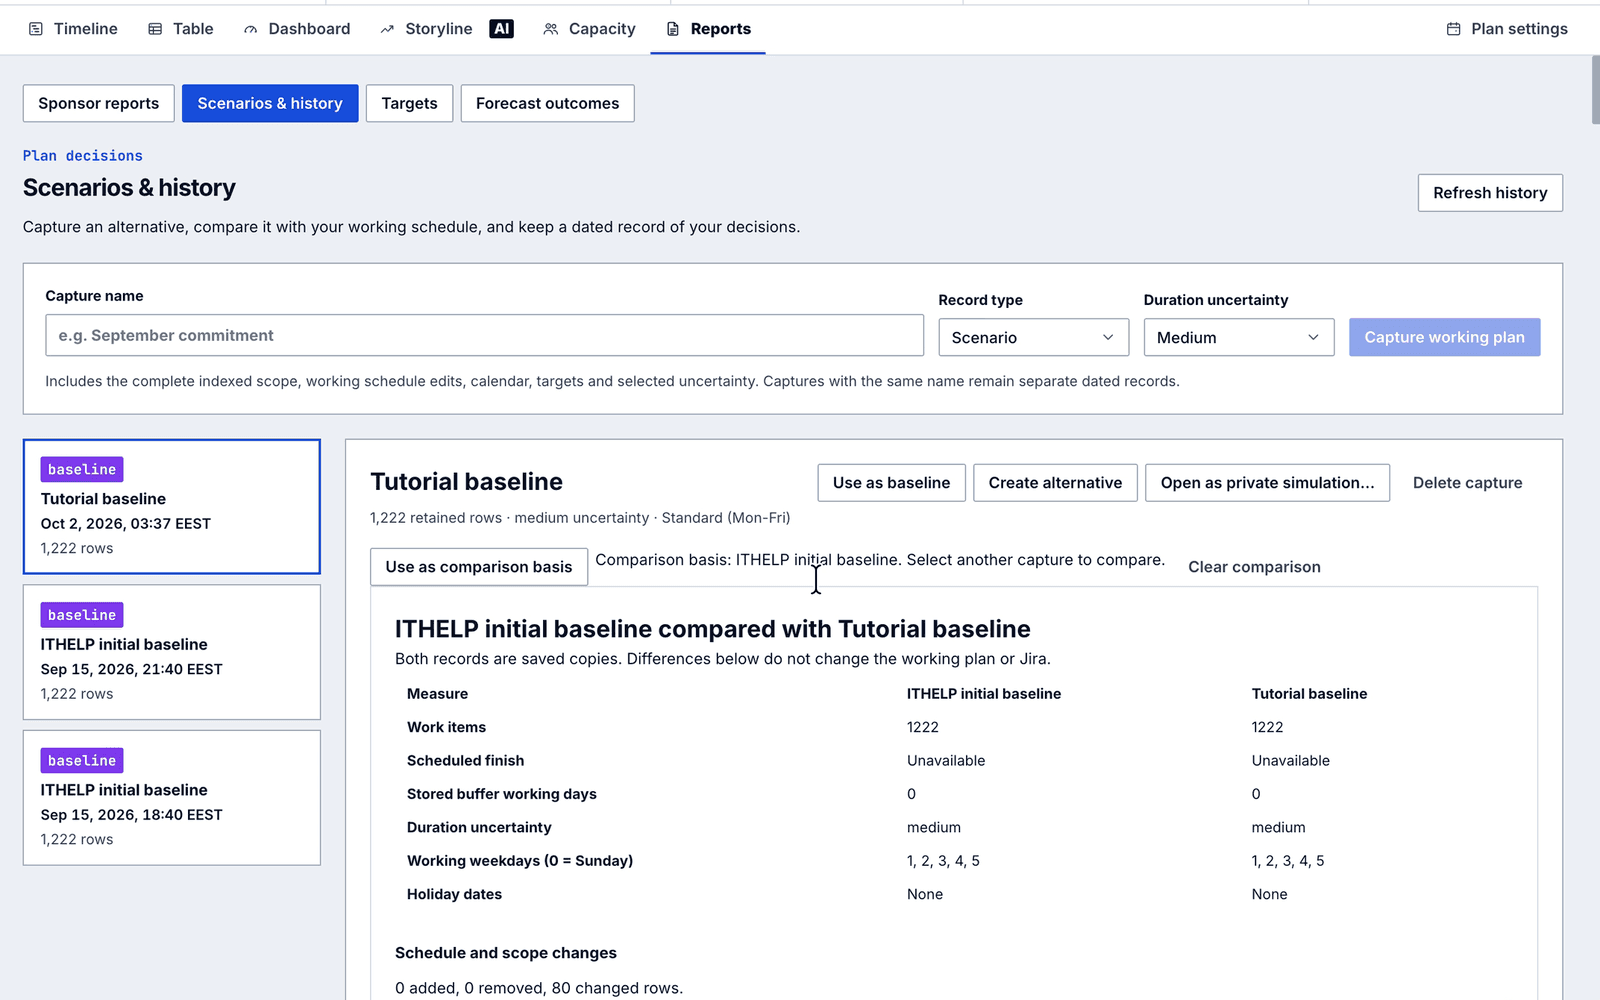
Capture the plan as a baseline in one click. The Timeline then draws where each bar used to be and counts what moved, the Table gains a vs baseline column, and you can compare two captures, set targets, check how past forecasts did, or try a change in a private simulation.
Scenarios and history: captured baselines with Use as baseline, Create alternative and Open as private simulation, and two captures compared. Comparing changes neither the working plan nor Jira.
For the Jira administrator
Permissions come from Jira, AI spend has limits you set, and every Apply to Jira is on record. The app's header shows the version your site runs, next to What's new.
Plans follow Jira permissions
You open a plan only when Jira lets you see every project and issue it is built from. Apply writes each change only where your own Jira account could make it.
AI limits
One switch for all AI features and one per feature, daily and monthly caps, and today's and this month's usage per feature with what each one sends.
REST API
Atlassian's app REST APIs with three permissions: read, change and administer plans. A call acts as the person who signed in, so their plan and Jira permissions still apply.
Audit log
Sixty days of who applied changes to Jira and who changed plans, reports, access, settings and AI features, read or downloaded by a Jira administrator over the REST API.
Settings, AI features: one switch for all of them, a switch per feature with its usage today, and the daily and monthly limits.
101 sections
The manual
The complete reference: how the schedule is worked out, every control on the Timeline, what each number means, saving and applying, reports and AI, administration, data and limits, and what to do when something does not behave as you expected.
01What LeanZero Management is
A Forge app for Jira Cloud that reads a chosen set of Jira issues into a plan, forecasts when the work lands against the dates you promised, and writes date and dependency changes back to Jira only when you apply them.
Jira stores a start date and a due date on each issue, but it has no schedule that reacts. Move one issue and nothing that waits on it moves, parents do not follow their children, and nothing tells you whether the work still lands before the date you promised. LeanZero Management adds that layer on top of your Jira issues.
You build a plan by saying where its issues come from (JQL queries, boards or whole projects). The app reads those issues, and the issues under them, into its own copy of the plan. Every plan then opens on the same tabs: Timeline, Table, Dashboard, Storyline, Capacity and Reports. The top of every plan answers five questions: will we hit the target date, what is late or blocked, what changed, what to do next, and can I trust these numbers.
The words you will meet
Plan
A named set of sources, a working calendar, optional targets and a list of members, plus the copy of the issues the sources match. You create one with the New plan wizard or with Import a Jira plan.
Source
One rule for pulling issues in: a JQL query, a board or a project. A plan can have any number of them, and they are merged into one plan.
Index
Reading the plan's issues from Jira into the app. It runs when you create a plan, when you press Refresh from Jira now in the plan's ⋯ menu, and every hour in the background.
Target
A date the plan promises, such as a launch or a go-live. Targets are not Jira issues and are never written to a ticket. The plan's status is judged against its commitment, which for targets added in the wizard is the latest one.
Work item
What every count in the app counts. Open work items are the plan's size, for example 72 open work items. An epic with no stories yet counts as a work item, dated or not. An epic or parent that holds stories in the plan is not counted as work: its dates come from the work under it.
NoteNothing reaches Jira until you press Apply and confirm the review. Your unsaved edits are kept as an autosaved draft, so a reload or a refresh from Jira does not lose them. Save stores your edits on the plan, where everyone who opens it sees them. Apply then writes the changed dates, dependencies and rank to Jira, and only where your own Jira account is allowed to make each change.
NoteAI is on for every site unless a Jira administrator turns it off. The AI features (Plan brief, AI structure and Storyline, Read the comments, Review with AI, Build with AI, Propose portfolios) run on Atlassian-hosted models through Forge LLM, count against a daily and a monthly limit, and are advisory: the AI never writes a date, a link or a rank. Each one can be switched off on its own.
02Where the app appears in Jira
A full page with Plans, Portfolios and Capacity in its top bar, a panel on every Jira issue, and a settings page for Jira administrators.
The three places you see the app
Where
Title in Jira
What you get
Apps menu (full page)
LeanZero Management
The app itself. Its top bar has three pages, Plans, Portfolios and Capacity, plus What's new and the version your site is running (the same number Manage apps shows). On a phone the three pages sit in one menu.
Jira issue view
LeanZero Management Position
Where this issue sits in a plan: how much room it has before it moves the plan's finish, what it waits on and what waits on it, with a CRITICAL PATH chip when it has no room. A PM and an Engineer view phrase it for each reader. When the issue is in several plans, a row of plan names lets you switch. When it is in none, the panel says "This issue is not in any LeanZero plan."
Jira settings, Apps
LeanZero Management Settings
Site-wide settings in six tabs: Calculation Engine, Field Mapping, Display, Plan Permissions, Maintenance and API Access. Maintenance holds the AI features card with the master switch, a switch per feature and the daily and monthly limits.
The top bar
Plans
Every plan you can open, one row per plan, sorted Needs you first. New plan, Import a Jira plan, New portfolio and Propose portfolios start here. See the Plans page section below.
Portfolios
Every portfolio, worst first, with its status, commitment, when it lands and what needs a person. A portfolio's page shows a bar per plan with each plan's own commitment marked.
Capacity
Each plan's team roster and over-committed weeks, across the plans you pick.
Inside a plan
Tabs
Timeline, Table, Dashboard, Storyline, Capacity and Reports.
Plan settings
Schedule (working days and holidays), Targets, Scenarios, Sources and Permissions.
The ⋯ menu
Refresh from Jira now, Health check, Configure fields, Export CSV, Plan info and Delete plan.
Header buttons
Save and Apply, Sponsor report and Plan brief.
What runs in the background
Every hour the app refreshes each plan from Jira. When an issue in a plan changes in Jira, the app updates that issue in every plan that holds it. A dependency added or removed in Jira reaches the plan within seconds. None of this needs anyone to have the app open.
LimitThe issue panel shows what the plan held at its last index. An issue added to a plan's scope since then reads as not in any plan until the plan refreshes, at the next hourly refresh or when someone presses Refresh from Jira now.
03Creating a plan
New plan on the Plans page opens a five-step wizard: Name, Sources, Schedule, Targets and Review.
On the Plans page, press New plan (on a phone, New). The wizard, headed Create a plan, has five steps across the top. You can click back to any step you have finished but not forward past one you have not. The footer's back button carries the previous step's name (for example ← Sources), Cancel leaves the wizard, and Continue → moves on.
The five steps
Step
What you do
Blocks Continue?
1 Name
Type the plan's name (up to 120 characters), or click one of the suggestions. Enter moves on.
Yes, until the name has text
2 Sources
Add one or more JQL, Board or Project sources.
Yes, until every source is filled in and no JQL query has been rejected by Jira
3 Schedule
Pick a working calendar and who can see the plan (Visibility).
No
4 Targets
Optionally add dates the plan promises, each a name and a date.
No
5 Review
Check the summary and press Create & Index.
Not applicable
Step 2: Sources
The step starts with one JQL source called Source 1. Each source has a name you can edit, a JQL / Board / Project switch and, when there is more than one source, a × to remove it. + Add another source adds another. A JQL query is checked by Jira as you type and shows Valid with an approximate count, an error in red, or a warning when it is valid but finds nothing you can see. A query still being checked does not block Continue; only one Jira has rejected does. The next section describes the three source types.
Build with AI (on a JQL source)
1Press Build with AI under the query box. The button appears only while AI and its Build with AI switch are on.
2Describe the issues in a sentence, for example open bugs in PROJ assigned to me, newest first, and press Generate.
3The app writes a query using your site's real issue types and statuses and looks up the people you name. Jira then checks and counts the query as you. Open, unresolved and outstanding mean everything not done.
4The answer shows the query, any notes on what was corrected, a line such as You asked for "…": this query finds ~N issues, and a few example issues. Check the examples are what you meant.
5Use this query is offered as the main button only when Jira accepts the query, nothing is flagged and it finds issues. Otherwise the button is Use anyway. Either one puts the query in the box, where the normal check runs again.
LimitBuild with AI counts against the site's AI limits. When the daily or monthly limit is reached the panel says so, for example Daily AI limit reached (100 of 100). The same Build with AI is offered when you edit a plan's sources later.
Step 3: Schedule
Working calendar lists the site's calendars (by default Standard (Mon–Fri) and Israel (Sun–Thu)), each with its working days spelled out. Visibility sets who can open the plan before you add anyone by name: Private (Only you and members you invite), Everyone can view, Everyone can edit or Everyone can administer. Private is selected by default. You add named members later under Plan settings, Permissions.
CarefulThe calendar you pick here is recorded on the plan, but it does not set the working days the schedule uses. Every new plan schedules on Monday to Friday with no holidays until someone changes it under Plan settings, Schedule. If your team works Sunday to Thursday, set that there after the plan is created.
Step 4: Targets
Optional. Each row is a name (up to 80 characters, for example Go-live) and a date. Rows missing a name or a date are dropped when the plan is created, and a plan holds at most 24 targets. The latest target becomes the plan's commitment, the date the plan's status is judged against. You can add, change or scope targets later under Plan settings, Targets.
What happens when you press Create & Index
1The plan is created and a status line reads Creating plan..., then Plan created. Indexing issues from N source(s)....
2The index is queued and runs in the background. The wizard waits for it, showing Indexing issues in the background….
3When it finishes you see Indexed N work items. If it takes longer than the wizard waits (16 minutes), a message says indexing is taking a while, will finish in the background, and that you can open the plan now.
4The wizard opens the new plan. If the index is still running, the plan fills in by itself when it finishes.
NoteA new plan also has plan protection on and Include parents on (see the hierarchy section). With plan protection on, when someone changes an issue's start in Jira so that it starts before the work it waits on allows, the app puts the previous date back and adds a comment headed LeanZero Management: Date change reverted. Neither setting has a control in the app; both can be changed over the REST API.
04Importing a Jira plan
Import a Jira plan turns a Jira Premium plan into a LeanZero plan with the same sources and date fields, without changing the Jira plan.
On the Plans page, open More and choose Import a Jira plan (the empty Plans page also shows this button). The import has four steps: Jira plan, Preview, Settings and Import. It reads plans from Jira Premium Plans (formerly Advanced Roadmaps) and copies the plan's issue sources, its exclusion rules and the date fields it schedules on. The Jira plan itself is never modified.
Jira plan: pick the plan to import. If Jira Plans is not available on the site, or Jira will not list the plans, the step says so and suggests building the plan from its boards, filters or projects instead.
Preview: shows exactly what the import will create, including the field mapping (plan-specific when the Jira plan schedules on its own date fields) and how dependencies are read.
Settings: the name (prefilled from the Jira plan), the working calendar and visibility. The Jira plan's lead is added as a plan admin.
Import: creates the plan, indexes it and checks which issues Jira will let the app update.
LimitListing, previewing and importing Jira plans needs Jira's Administer Jira permission, because Jira's Plans API requires it. Anyone else can still build the same plan from its boards, filters or projects with New plan.
05Sources: JQL, board and project
What each source type pulls in, how it is checked, how several sources combine, and how to change them after the plan exists.
The three source types
Type
You give
What the plan reads
JQL
A query
Every issue the query matches.
Board
A board, picked by name
The board's issues.
Project
A project, picked by name or key
Every issue in the project, in rank order. For a subset, use a JQL source instead.
Picking a board or a project
In the wizard, Board and Project sources use a search box. Type to search, use the arrow keys and Enter to choose, Escape to close. A moment after you pick, a panel confirms what you chose. For a board: its name, its project, how many issues are on the board, and the JQL of the filter behind it. The plan also brings in the child issues and sub-tasks under them, so it can hold more rows than that count. For a project: its name, key, whether it is company-managed or team-managed, its lead, an approximate count and up to six of its issue types. If Jira cannot show it, the panel says Board not found (or no access) or Project not found (or no access).
NoteEvery lookup in the wizard (the JQL check, the counts, the board and project search) asks Jira as you. If Jira refuses you a board, a filter or a project, you see that refusal, not what the app itself could see.
CarefulThe counts in the wizard are not the size the plan will have. They count only what each source matches. The indexed plan is usually larger, because the stories and sub-tasks under the matched issues are pulled in too (see the hierarchy section), and a board's count is its filter's count, which can differ from what the board shows.
Several sources
Sources are read one after another and merged by issue key, so an issue that two sources match appears once.
Changing a plan's sources later
1Open Plan settings and choose Sources (or open Plan info from the ⋯ menu and press Change what this plan reads).
2The Issue sources dialog lists each source with its name, a JQL / Board / Project choice, and the query, board ID or project key. Build with AI is offered on JQL sources here too.
3Press Save & re-index. The sources are replaced and the plan is indexed again. Issues the new sources no longer match leave the plan. Nothing in Jira is changed.
NoteSaving the sources also makes you the person whose Jira view the plan follows (see the access section). That is how an editor who can see all of a plan's issues takes it over when its creator can no longer see them or has left.
06Hierarchy: children, parents and orphans
The index pulls in every issue under what your sources match, can pull in missing parents, and marks issues whose parent is outside the plan.
Children are always pulled in
A source rarely returns a whole tree. A query for epics returns only the epics, not their stories or sub-tasks. So after reading the sources, the index walks down Jira's parent field level by level and adds every issue under the matched ones, whatever your hierarchy levels are called. The hourly refresh does the same. This is why a plan is usually larger than its sources' counts: a query that previewed about 40 epics can index several hundred work items.
Parents: Include parents
A source that matches a story but not its epic would leave the story at the top level of the plan. With Include parents on, the index also walks up and adds the missing parents, then their parents, and so on. It walks up only after walking down, and never walks down again from a parent it added, so adding an epic does not drag in all of that epic's other stories. Include parents is on for every plan created with the wizard or the import. It has no control in the app; it can be changed over the REST API.
The orphan badge
When an issue's parent is in Jira but not in the plan, the Timeline shows the issue at the top level with a small badge reading ↑ and the parent's key. Clicking the badge opens the parent in Jira. Its tooltip says the parent is not in this plan, so the item shows at the top level.
How the hierarchy is counted
Counts are of work items. An epic or parent that holds stories in the plan is not counted as work: it spans its children, and its dates come from them. An epic with no stories yet counts as one work item. If it has no dates, it counts as undated work, and the Timeline lists it under No dates with the other work that has no dates, instead of hiding it. Breaking one such epic into stories later changes that epic's count, not the size of the rest of the plan.
TipEpics with no stories are named wherever the plan's size is shown, for example 287 undated epics with no stories yet on the Plans page, so you can tell an unplanned backlog from undated work.
07Which Jira fields the app reads and writes
The date and scheduling fields the app relies on, the two it creates on first use, and where to change which field ids it uses.
The scheduling fields
Field
Default
Used for
Start Date
customfield_10015 (Jira's Start date)
Each work item's start
Due Date
duedate
Each work item's finish
Duration
customfield_11581, or the PPM Duration field the app creates
Length in working days
Buffer
customfield_12399, or the PPM Buffer field the app creates
Marks an item as buffer (Yes or No)
Rank
customfield_10019
Jira's rank order, which the Table's Jira rank sort follows
The app also reads each issue's summary, type, status, parent, assignee, priority, labels, resolution, reporter, created and updated dates, sub-tasks, issue links and story points. Story points are always read from customfield_10016 and cannot be remapped.
The first index on a site
The first time any plan is indexed, the app looks for fields called Start date, Duration (or PPM Duration) and Buffer (or PPM Buffer). If Duration or Buffer does not exist, it creates a number field called PPM Duration and a select field called PPM Buffer, and adds the three fields to the edit screens of the projects named in the plan's sources, and to the Default Screen.
CarefulThe app finds those projects only from Project sources and from JQL written as project = KEY. A plan built from boards, or from JQL with project IN (…) or a filter, adds the fields only to the Default Screen, which may not be the edit screen your projects use. If Duration or Buffer never shows on your issues, check that project's edit screen.
Changing which fields are used
A Jira administrator can point the app at other field ids in LeanZero Management Settings, Field Mapping. A plan imported from a Jira plan can carry its own mapping, so it schedules on that plan's date fields. Inside a plan, Configure fields in the ⋯ menu shows whether Jira will take the plan's changes on each issue, and can add missing fields to a project's screens after you confirm.
Dependencies
A Jira issue link becomes a dependency in the plan only when its type is the configured dependency link type (Blocks by default) and the issue at the other end is in the same plan. The same Jira link can therefore be a dependency in one plan and absent from another.
Issues with no dates
Nothing is invented at index time. An issue with no start and no due date has no bar of its own and counts as undated. Items without both a start and a due date are called not fully dated, and items whose start is after their due are named as dates that don't fit.
08Who can open a plan
A plan's own roles decide what you may do in it, and Jira's project permissions decide whether you may open it at all.
Each plan has an owner (its creator), named members with a role, and a default access for everyone else, set by Visibility in the wizard. Jira administrators are plan admins on every plan. Viewers can read the plan. Editors can change its schedule, save and apply. The owner and plan admins can also delete the plan and manage who has access to it.
Plans follow Jira's project permissions
Since 4.12.0 you can open a plan only when Jira lets you see every project and every issue it is built from, including issues with a security level. This holds in the app and over the REST API. A plan you cannot see in full stays on the Plans page as a closed row, with what to ask a Jira admin for, and nothing else of it is shown.
Why a plan can show as closed
The row says
What it means and what to do
Closed by Jira permissions
Jira does not let you see some of the plan's projects or issues. Ask a Jira admin for Browse projects on every project in the plan, and access to any of its issues that have a security level.
Access not confirmed
Jira did not answer in time. Try again in a moment.
Needs a re-index
Something the plan is built from changed in Jira (a project deleted, archived, renamed or hidden from the app). The owner, a plan admin or an editor can re-index it.
Checked when you open it
Your access is checked when you open the plan. It opens if Jira lets you see everything it is built from.
Whose view of Jira a plan holds
A plan holds only the issues that the person who created it, or who last saved its sources, can see in Jira. If that person loses access to some of them, the plan leaves them out at its next refresh. If they can see none of them any more, the plan empties and says so, naming who can fix it. If Jira no longer recognises that person, the plan keeps its data and stops refreshing. In each case an editor who can see all of the plan's issues takes it over by saving its sources.
NoteThe owner, a plan admin or a Jira administrator can still delete a closed plan, and the owner or a plan admin can narrow its sources or re-index it.
09What indexing does
Indexing reads every source, walks the hierarchy, keeps only what the plan's person may see, and stores the result. It runs in the background and never empties a plan by accident.
One index, in order
1The plan's status becomes Indexing….
2On the site's first index, the scheduling fields are found or created (see the fields section).
3Every source is read and the results are merged by issue key.
4Issues the plan's person cannot see in Jira are left out.
5Every issue under the matched ones is added, then the missing parents when Include parents is on.
6Dependencies are worked out (only links whose other end is in the plan), and each issue is checked for whether Jira will let Apply update it.
7The plan is stored, its status becomes Ready, and the plan is measured again for the Plans page. An open plan loads the fresh data by itself.
It runs in the background
An index is queued and runs in the background with up to 15 minutes to finish, so a large plan does not time out. You do not have to wait for it: open the plan and it fills in when the index finishes. If a queued index never starts, or runs past its time, the plan reports that indexing did not start, or timed out, and asks you to retry. Press Refresh from Jira now to run it again.
A re-index that matches nothing keeps the old data
If a re-index matches no issues but the plan held issues before, the app keeps the previous data, and the plan says that the last re-index matched 0 issues, that the previous data was kept, and to check the plan's sources. A permission blip or a query that stopped matching cannot wipe a schedule. The exception is a plan whose person can no longer see the issues it held: that plan is emptied, as described in the access section.
Your edits survive a refresh
A refresh from Jira, manual or hourly, pulls fresh Jira data and puts your unsaved edits back on top from your autosaved draft. Edits you saved but have not applied are kept too, field by field, except on a field Jira itself changed since: there Jira's value wins, yours is dropped, and the app names the drop. When the plan holds edits like that, Refresh from Jira now asks you to confirm first.
How long it takes
It depends on how many issues the sources match, how deep the hierarchy under them goes, and how quickly Jira answers. A plan of a few hundred issues takes a handful of Jira requests. A plan of several thousand issues across several levels takes many more.
10The Plans page, plan statuses and the hourly refresh
How the Plans page lists, words and sorts your plans, the busy states a plan passes through, and how plans stay current with Jira.
The Plans page is a table with one row per plan: Plan, Status, Commitment, Forecast finish, Next target and Needs attention, plus Trend · 7 days once plans have about a week of history. The Plan cell gives the name, the project keys, the size (for example 1,978 open work items), the owner and, when there are any, the undated epics with no stories yet. On a narrower window the table drops Next target first, then Trend, and leaves out whole details rather than cutting words. On a phone each plan becomes a short card with the same fields. Every date shows its year.
The status words
Word
Meaning
On track
The forecast finish is before the commitment with more than 10 working days of room, and work has begun.
Tight
The forecast finish is before the commitment but with 10 working days of room or less, or half the work has no slack.
Late (forecast)
The forecast finish is after a commitment that is still ahead.
Overdue
The commitment date has passed and work is still open.
Late (at least)
Less than 80% of the open work has dates, and the dated work alone already finishes after a commitment that is still ahead. The gap shown is the least it can be: the undated work can only add to it.
Can't tell yet
Less than 80% of the open work has dates, and the dated work alone would read On track, Tight or Not started. The plan cannot vouch for that, so it does not say it.
Not started
The forecast finish is before the commitment with room, and the work has not begun yet.
No commitment
The plan has no target to be judged against. Inside a plan the same word reads No target.
Delivered
All the work is done.
Not measured
The app could not measure the plan's finish against its commitment.
Updating…
Right after an app update, the plan is being measured again under the new version's rules. It takes its place within seconds.
Confidence
Under the status word a line gives the confidence and its reason, for example Medium confidence · 64% dated or Low confidence · 17% dated. When less than half of a plan's open work has dates, the confidence is Low and the status chip is drawn outlined instead of solid.
The count line above the table
Above the table a line counts every plan once: late, at risk, on track, can't judge yet, no commitment, not measured, delivered, behind a Jira check, and updating. Each count is a button that filters the table to those plans. Late includes every Late (at least) and Overdue plan whatever its confidence, and the line then says how many of them rest on low confidence, for example 12 late · 12 of them low confidence. Can't judge yet holds every Can't tell yet plan and every On track, Tight, Not started or Late (forecast) plan on Low confidence. The same line ends with Refreshed hourly from Jira and the time the list was read.
Needs you first
The table opens sorted Needs you first, in two groups: the plans judged from dated work, then those with too little dated work to judge. Within each group the plans that need a person come first, such as a plan with a blocked item, a commitment within a week or already past, or tickets past due, and in the first group a Late or Tight status. Plans being updated come next, and plans Jira closes to you come last. The other sorts are Nearest commitment, Biggest slip, Recently changed and Name, and you can group by Portfolio or Project.
Other controls on the Plans page
Views: All, Needs attention (with its count), My plans and Changed since I looked.
Find a plan or project key searches by plan name and by the Jira project a plan is built from. Cmd+K (Ctrl+K on Windows) jumps to it; Escape clears it.
More holds Import a Jira plan, New portfolio and Propose portfolios. Each row's ⋯ menu holds Move to portfolio, Plan info and Delete plan.
When at least half of the plans share one problem, such as most of their work having no dates, a bar at the top says it once with How to fix this.
Busy states
Shown as
What is happening
New
The plan was created but has not been indexed yet.
Queued…
A re-index is waiting its turn. What you see is from before it.
Indexing…
The plan's issues are being read from Jira.
Calculating…
The schedule is being worked out.
Being written to Jira…
Someone is applying the plan's changes. When the app knows who, it names them, for example Being written by Ana….
Error
The last re-index failed. The plan says why; re-index it to try again.
How plans stay current
Every hour the app refreshes each plan from Jira. It skips a plan that was indexed in the last 55 minutes or is busy, first asks Jira cheaply whether anything in the plan's scope changed, and stores nothing when nothing did. Between refreshes, an issue edited in Jira is updated in every plan that holds it, and a dependency added or removed in Jira arrives within seconds. After a Save, a Discard All or an Apply, the plan is measured again so its row on the Plans page shows the new numbers. Refresh from Jira now in the plan's ⋯ menu runs a full index at any time.
LimitDeleting a plan, from a row's ⋯ menu or the plan's ⋯ menu, removes it and everything the app stored for it, and cannot be undone. Nothing in Jira changes: issues, dates and links stay as they were last applied.
11The successor rule
The one dependency rule the scheduler is built on: a linked task starts on the next working day after its latest predecessor finishes, plus the link's lag, and nowhere else.
LeanZero Management schedules with one dependency rule. A dependency says "A blocks B". B must start on the first working day after A's due date, plus the link's lag in working days if it has one. The rule holds for every task behind a dependency, on every change, including the task you just edited.
The rule
required start of B = the latest, over every predecessor P that has a due date, of:
    the first working day after P's due date
    + the lag on the P → B link, in working days

B's start  = that required start
B's finish = B's start + B's work in working days
What each part means
The first working day after the due date
The predecessor's due date is a day of work, so the successor cannot share it. A predecessor due on a Friday is followed on the Monday, and any plan holiday in between is skipped.
The latest of all predecessors
A task with several predecessors waits for whichever one requires the latest start. With lags, that is not always the predecessor that finishes last: an earlier finisher with a long lag can be the one that decides.
A predecessor with no due date
It constrains nothing. A task whose predecessors are all undated keeps its own dates.
A Done predecessor
It still binds. Its successors are placed after the due date it actually has, and the schedule never moves the Done ticket itself (see Done tickets and open work past its due date).
CarefulThe required start is where the task starts, not the earliest it may start. If you pull a predecessor's due date earlier, its successors come earlier with it. Example: A 01 Jun to 10 Jun blocks B 11 Jun to 12 Jun. Change A's due to 03 Jun and B moves to 04 Jun to 05 Jun. To hold a task later than its predecessor allows, give the link a lag, or put a start-no-earlier-than hold on the task.
LimitThere is one dependency type. Start-to-start, finish-to-finish and start-to-finish links do not exist in the product. A Jira issue link counts as a dependency only when its link type is the one set under Settings, Calculation Engine, Issue Link Type Name (default Blocks). The issue that blocks is the predecessor; the issue it blocks is the successor. Links of any other type are ignored.
When an edit breaks the rule
If you move a linked task's start away from its required start, earlier or later, the edit is refused: the task goes back to its required start and the rows your edit would have moved stay where they were. A refused edit stages nothing. Changing only the due date of a linked task is not refused: the start stays on the required start and the task keeps the finish you typed. If that finish is before the earliest the task can start, the task is placed at that start with its work kept, and you are told. Before you drag, hovering a pinned bar already names the predecessor that pins it and how to move it.
The warnings you see
What you did
Warning
Moved a linked task earlier than its link allows
B must start the working day after A finishes, then the required date, then "Cannot move before." With a lag it reads "B must start 2 working days after A finishes".
Moved a linked task later than its link allows
The same sentence, then "Cannot move after: a linked task starts on that day, not later. To start it later, change the link's lag or move A."
Moved a held task earlier than its hold
"R is held to start no earlier than" the hold date, then "Cannot move before."
Several refusals from one change
"N work items snapped to respect dependency rules"
12Working days, holidays and the plan calendar
Each plan has its own working week and holidays; how a start, a due and a holiday on a non-working day are treated, and what changing the calendar does.
Every plan has its own calendar: a working week and a list of holidays. A day is a working day when it falls on a working weekday and is not a plan holiday. Durations, lags and the successor rule all count working days on this calendar. A plan that never had its calendar edited runs Monday to Friday with no holidays.
Setting the calendar
1Open the plan, then Plan settings, Schedule. The Plan Schedule page opens.
2Under Select a Calendar, pick a preset: Standard (Mon-Fri), Israel (Sun-Thu), UAE (Mon-Fri + Sat half) or 6-Day (Mon-Sat). The UAE preset schedules Monday to Friday; the half Saturday is not scheduled.
3Or build a Custom Calendar: give it a Name and tick its Working Days.
4Under Bank Holidays, pick a date and an optional name (for example Christmas) and add it. Holidays are kept sorted by date, one per date.
On the Timeline
At the closer zoom levels, holidays are drawn as highlighted columns across the rows and marked in the date header, and weekends are shaded. Hovering a holiday shows its name, or "Holiday:" and the date when it has none.
Dates that fall on a non-working day
Case
What the schedule does
A start on a weekend or holiday
The start moves forward to the next working day. Example: a 2-day task starting Sat 06 Jun is scheduled Mon 08 Jun to Tue 09 Jun.
A due date on a weekend or holiday
It stays where it is. The work ends on the last working day before it, and tasks it blocks start on the next working day after it. The date editor and the Apply review say so, for example: "Sat Oct 10 is not a working day on this plan's calendar: the work ends Fri Oct 9, and anything it blocks starts no earlier than Mon Oct 12."
A holiday inside a task that has a Duration
The work is kept, so the finish moves out. Example: Duration 5 from Mon 08 Jun with a holiday on Wed 10 Jun finishes Mon 15 Jun instead of Fri 12 Jun.
A holiday inside a task with no Duration
The task keeps its Jira dates. A holiday never shrinks the work of a task that spans it.
NoteWhen the working week or the holidays change, the whole plan is scheduled again and the toast "Dates recalculated for new working day schedule" appears. A calendar change is not an edit of any ticket, so nothing is staged for Apply. Tickets the new calendar moves away from their Jira dates are marked on the Timeline as moved by the plan, and you can adopt those dates if you want them in Jira (see Edits, the plan's schedule and what Apply writes). Calendar changes reach everyone who has the plan open.
13Duration
Duration is work in working days, counted from the start; where it comes from, what 0 means, and how a push treats a task whose dates are longer than its work.
Duration is the number of working days a task occupies, counted from and including its start. Duration 1 means the task starts and finishes on the same day. Duration 5 starting on a Monday finishes on the Friday. Duration 0 declares a milestone: a point on its start date.
Where the number comes from
From the Jira field an administrator maps as Duration under Settings, Field Mapping.
When Jira holds no Duration for a ticket, the app measures the ticket's own Jira dates in working days, on the plan's working week, and carries that much work. A Duration the app measured is not written to Jira.
In the date editor (click a bar, then Dates…) you can type a whole number of days from 0 to 2000, or clear the field. Typing 0 turns the task into a milestone on its start date.
How edits change it
Typing a start
The task moves and keeps its work: the finish follows the new start.
Typing a due
The start stays and the Duration is measured again from the start to the new due, so the number matches the bar.
Resizing a bar
Dragging either end changes the Duration, and the new Duration is saved with the dates.
Moving a bar
Dragging the middle keeps the task's length in working days. No Duration is saved for a move.
Being pushed by a predecessor
The task keeps its work: its new finish is its new start plus its Duration.
NoteSome Jira tickets carry dates that span more working days than their Duration. When such a task is pushed later, it never finishes earlier than the due date Jira holds: the extra days absorb the push until the work no longer fits. Example: B has Duration 2 but Jira dates 04 Jun to 19 Jun. Its predecessor's due moves to 05 Jun, so B starts 08 Jun and still finishes 19 Jun.
CarefulA push that moves a task's start past its old due rebuilds the due from the task's work, so the finish is never before the start. A pair of dates that is already inverted in Jira (due before start) is left as it is and reported by the Health check as dates that don't fit.
14Per-link lag
How to hold a successor back by N working days, where the lag is kept, who sees it and when it is saved.
Lag is a delay on one dependency link, counted in working days. It belongs to the link, not to either task: the same successor can follow one predecessor immediately and another five working days later. Since 4.15.0 a lag is stored against the Jira issue link itself. A link that is removed and drawn again in Jira starts with no lag.
What a lag of N does (predecessor due Wed 10 Jun 2026, Monday to Friday, no holidays)
Lag
Successor starts
Why
0 or none
Thu 11 Jun
The next working day
1
Fri 12 Jun
One working day later
2
Mon 15 Jun
The weekend is skipped, not counted
3
Tue 16 Jun
Three working days later
5
Thu 18 Jun
Five working days later
Setting a lag
1On the Timeline, click the dependency arrow between two bars. A menu opens headed "A blocks B", with a "staged" badge if the link is not in Jira yet.
2Use the − and + buttons beside "Lag (working days)". The − button is disabled at 0.
3The plan is scheduled again at once on the new lag, so you see where every bar lands. "Remove link" in the same menu removes the dependency.
When the lag is saved, and who sees it
On a link that is already in Jira, the lag is saved to the plan as soon as you set it and everyone who opens the plan sees it. Undo does not take it back; change it back in the link's menu. The dates it moves are staged like any other change you make.
On a link you have drawn but not applied yet, the lag travels with the staged link and is saved with your other edits. Apply creates the link with its lag. If Apply creates the link but cannot save the lag at that moment, the link stays in your staged changes with its lag and the next Apply saves it.
If someone else changed the lag after you opened the plan, your change is refused, nothing is saved, and the message says what they set. If you and a colleague stage the same new link with different lags, Apply asks "Two lags for one link" with Keep mine and Take theirs.
Setting a lag and then putting it back stages nothing.
The Apply review, Review with AI and the Apply progress list show each new link's lag, for example Lag 3 working days or No lag.
A plan whose lags are still in the older storage format moves them when it is opened or at its next refresh. Until then a new lag on it is refused with a message to try again in a minute or two; removing a lag still works.
LimitThe stepper stops at 0. There is no lead time: a successor can never start before its predecessor finishes.
15Start-no-earlier-than holds
A hold keeps a task from starting before a date; how it combines with dependencies, and how it is set.
A hold says a task cannot start before a given date. The schedule places the task at the later of what its predecessors require and the hold, and everything after it follows. A hold on a weekend or holiday moves to the next working day. A hold on a parent, such as an Epic, holds everything inside it.
How a hold behaves
Task
Result
Has predecessors, hold is later than they require
Starts on the hold. Example: A due 03 Jun blocks B (2 days), hold on Sat 13 Jun. B runs Mon 15 Jun to Tue 16 Jun and B's successor follows on 17 Jun.
No predecessors, starts before the hold
Lifted to the hold, keeping its work. Example: 01 Jun to 03 Jun with a hold on 10 Jun becomes 10 Jun to 12 Jun.
No predecessors, already starts after the hold
Keeps its own start. A hold never pulls a start earlier.
You drag it earlier than the hold
Refused, with the hold named in the warning.
LimitHolds are set and cleared through the REST API; the app has no screen for setting them yet. In the app, a held task says so on hover, and a task the hold moved is marked as moved by "a start-no-earlier-than hold". A hold is part of the plan, like a lag: it is never written to Jira and never appears in Apply. With plan protection on, a Jira edit that moves a held task earlier than its hold is put back.
16Buffers: the due holds, the length shrinks
What Buffer = Yes does when a slip reaches the task, what exhausted means, how it looks, and what Apply writes for it.
A buffer is an ordinary task with the Buffer field set to Yes (toggle No or Yes in the date editor, or set it from the Table). Its due date is treated as a commitment. When a slip pushes it, its start moves later and its due date stays where it is, so its length shrinks by the slip. The tasks after it do not move.
Buffer states
State
Dates
On the Timeline
Absorbing
Start later, due unchanged, fewer working days
Amber stripes, legend Buffer
Exhausted
Pushed past its due: it becomes a one-day task on the required start, and the slip passes to its successors
Violet stripes, legend Exhausted buffer
No due date in Jira
Nothing to hold: a declared Duration is carried as for any task; with no Duration, a one-day task
Amber stripes
Details
The due a buffer holds is the one Jira has, not a date an earlier unsaved edit gave it, so several edits in a row cannot creep the commitment.
An absorbing buffer protects everything after it. An exhausted buffer no longer does: the slip reaches its successors.
Why did this move? counts a buffer as absorbed or exhausted, never both, and the strip above the plan says how many buffers absorbed the change and shows an exhausted chip.
Buffer is a leaf-task setting: a parent cannot be a buffer.
NoteHow much of a buffer was used is shown but never written to Jira. Apply writes the buffer's moved dates and leaves the Duration Jira holds alone, so a declared buffer of 5 days is not overwritten with the 3 that are left. A Duration you type on a buffer yourself is written.
17Parents roll up; milestones are declared
Parent dates always span their children; a dependency into a parent holds back its children; milestones are declared by Duration 0 or a Milestone issue type.
Parent roll-up
A parent's dates, for example an Epic's, are not scheduled. They are its children's span: the start is the earliest child start (moved to a working day) and the due is the latest child due. This holds on every screen and in what Apply writes. A parent whose children have no dates keeps the dates Jira holds.
NoteA link that blocks an Epic applies to everything inside it, and the Epic then rolls up from them. Example: X, due 10 Jun, blocks Epic E. E's stories, previously starting 01 Jun and 04 Jun, both start Thu 11 Jun, and E runs 11 Jun to 15 Jun.
CarefulParent bars cannot be dragged or resized. The date editor for a parent shows a "Rolled up" badge, read-only Start and Due with "from" chips naming the child that sets each date, no Duration or Buffer, and the line "Dates roll up from this issue's children. Edit a child to change them." To move an Epic, move its children.
What Apply writes for a parent
An Epic's start or due is written to Jira only when its tasks, as they now stand, give it that date; otherwise the Epic keeps the date it has in Jira. A parent whose dates differ from Jira only because of the roll-up is listed under Parent rollups in the review of rows that differ from Jira, unticked, since most teams leave parent dates to the roll-up.
What makes a milestone
Condition
Milestone?
The issue has children in the plan
Never; its dates are a roll-up
Buffer = Yes
Never
Start and due are not the same day
No; a milestone is a single day
Duration is exactly 0
Yes
The Jira issue type is named Milestone (any case)
Yes
How milestones behave
A milestone moves with its predecessors and stays a single day with Duration 0. Example: A blocks milestone M; A's due moves to 10 Jun, so M sits on 11 Jun, Duration still 0.
A one-day task is not a milestone. Only Duration 0 or the Milestone type makes one.
A Milestone-type issue that spans several days is scheduled and drawn as an ordinary bar.
On the Timeline a milestone is a diamond in its state's colour.
18Done tickets and open work past its due date
The schedule never moves a Done ticket, and open work whose due date has passed is forecast to finish after today without changing its Jira dates.
Done tickets are never moved
A ticket in Jira's Done status category keeps its dates: no change elsewhere in the plan moves it, and Apply never stages it. Its successors are placed after the due date it actually has. Example: A blocks B (Done, 04 Jun to 05 Jun) blocks C. A's due moves to 10 Jun; B stays 04 Jun to 05 Jun and C keeps 08 Jun to 09 Jun. The only way to change a Done ticket's dates is to edit that ticket yourself.
Open work past its due date
An open ticket whose due date has passed has not finished on that date. For the plan's forecast it is given a new finish after today: its remaining work, counted from the first working day after today, and never earlier than its own due date. Remaining work is Jira's remaining estimate converted to working days (rounded up, using the plan roster's working day, or 8 hours when the roster names none), and 1 working day when the ticket has no estimate. Its start is kept. The tickets after it move with the forecast.
Example: today is Wed 10 Jun; A (open, 01 Jun to 05 Jun) blocks B (3 days)
A's remaining estimate
A forecast to finish
B forecast
None
Thu 11 Jun
Fri 12 Jun to Tue 16 Jun
3 days
Mon 15 Jun
Tue 16 Jun to Thu 18 Jun
LimitThe forecast is never written to Jira. The plan's dates, the Table and Apply are unchanged by it. The Timeline draws the extra time beside the bar as a pink striped extension, with the legend "Forecast, not a Jira date", and the bar reads Late. The plan card, portfolio, plan header, Dashboard, Plan brief, sponsor reports and since you last looked all use the same forecast finish. Done tickets, buffers and parents are never forecast this way.
19The order the plan is scheduled in, and dependency loops
Why every predecessor settles before the task that reads it, how a merge point waits for its latest branch, and what happens to a dependency loop.
The plan is scheduled in dependency order: every predecessor is placed before the task that depends on it, every child before its parent, and every parent before the tasks that depend on the parent. Each task is placed once, after everything it reads is final. The same order is used for a single edit, where only the tasks downstream of the edit can move, and for a whole-plan recalculation such as a calendar change.
Merge points
A task with several predecessors starts after the latest of them. Example: A blocks B1 (2 days) and B2 (10 days), and both block C. A's due moves to 10 Jun. B1 runs 11 Jun to 12 Jun, B2 runs 11 Jun to 24 Jun, and C starts Thu 25 Jun, the working day after B2, not after B1.
CarefulYou cannot create a loop in the app. While you draw a link the chip says "Can't link an issue to itself", "Already linked" or "Would create a cycle", and a link that would close a loop is refused with the reason, for example "B already leads back to A through C, so this link closes a loop." A loop can still arrive from Jira. The schedule then ignores one link in each loop and schedules the rest normally, the same way every time. A banner on the Timeline and Table says how many loops the plan has and which link is ignored, with Show on Gantt to jump to the rows. The Health check lists them under Dependency loops the schedule ignores. Remove or redirect the link in Jira to get the schedule you drew.
The same rules on the server
The rules in this chapter also run on the server, for edits made over the REST API and for plan protection, which uses the plan's own working days. Automated tests hold the two to the same dates.
20Edits, the plan's schedule, and what Apply writes
What a drag, a resize and a date-editor save do; how dates the schedule moves are shown and adopted; which values Apply writes and which are only computed.
Dragging on the Timeline
Gesture
Where you grab
What it does
Move
The middle of a bar
Moves the task. The start lands on a working day in the direction you drag, and the due is rebuilt so the task keeps the same number of working days. No Duration is saved.
Resize left
The left 6 px of a bar
Changes the start and keeps the due. The new Duration is saved. A step that would put the start on a non-working day is skipped.
Resize right
The right 6 px of a bar
Changes the due and keeps the start. The new Duration is saved. Same non-working-day rule.
Other ways to change dates
Click a bar to open its card, then Dates… to open the date editor: Start, Due, Duration in days, Buffer No or Yes, and the task's links under Blocked by and Blocks, each with a remove button that asks to confirm.
Edit Start, Due, Duration or Buffer in the Table (Duration and Buffer are under Columns), or use Select rows and set a field once for all the selected rows. The plan is then scheduled again in one pass.
Escape during a drag cancels it. The schedule recalculates once, when you drop.
Cmd+Z (Ctrl+Z on Windows) undoes your last change to the plan, up to 50 steps; one drag is one step however many tickets it moved.
The plan's schedule versus Jira's dates
Opening a plan stages nothing. Where the schedule places a ticket away from the dates Jira holds, because of a dependency, a lag, a hold or the calendar, the Timeline and Table draw the scheduled dates and mark the row: a teal end-cap on the bar and a hollow diamond on Jira's own date (legend "Plan moved it from Jira's date"). The toolbar counts them, for example "5 tickets differ from Jira". Open the review to see each one and choose Adopt N selected or Leave Jira as it is. Adopting stages those dates as your own edits; Done tickets are listed but never offered, and dates the schedule would put in the past are listed unticked.
What Apply writes and what it only shows
Value
Written to Jira?
Dates and fields you changed
Yes
Dates your change pushes on tickets that already have those dates in Jira
Yes
A Duration you typed, or set by resizing a bar
Yes, where it differs from what Jira holds
A Duration nobody typed (measured from dates, or carried through a push)
No
How much of a buffer was used
No
An Epic end that no child holds
No; the Epic keeps its Jira date
The due shown for a ticket with a start and a Duration but no due date
No
The forecast for open work past its due date
No
Lags and start-no-earlier-than holds
No; they belong to the plan
Dates on a Done ticket
Only if you edit that ticket yourself
Why did this move?
After an edit, a strip above the plan says "Your change moved N work items", how far the finish moved, how many buffers absorbed it and how many were exhausted. Its Why did this move? button opens a headline for the change, then lists which tickets it moved and the predecessor that moved each one. It is computed by the schedule engine; no AI is involved. The strip goes away once the change is applied or discarded.
The headline in Why did this move?, first match wins
Condition
Headline
Your edit was refused by a dependency
Edit blocked
A milestone moved later
Milestone slipped
The finish moved 10 or more working days later
Finish slipped
A buffer was exhausted
Buffer spent
The finish moved 1 to 9 working days later
Finish slipped
A buffer absorbed the change
Buffer absorbed it
A milestone moved earlier
Milestone earlier
The finish moved earlier
Finish pulled in
Other tickets moved, nothing committed was hit
Contained
21Two worked examples
A three-link chain re-planned by one edit, and a buffer that absorbs a slip and is then exhausted by the next one, both run through the scheduling engine.
NoteMonday to Friday, no holidays. 2026-06-01 is a Monday. Mon 01, Tue 02, Wed 03, Thu 04, Fri 05; Mon 08 to Fri 12; Mon 15 to Fri 19; Mon 22, Tue 23, Wed 24. Every ticket has its dates and Duration in Jira.
Example 1: one edit re-plans a chain
A blocks B, and B blocks C. No buffers, milestones or lags. You drag A's right edge from Wed 03 Jun to Wed 10 Jun.
Before and after
Ticket
Before
After
Why
A (edited)
01 Jun to 03 Jun, Duration 3
01 Jun to 10 Jun, Duration 8
Your edit. The Duration is measured again: 8 working days.
B
04 Jun to 08 Jun, Duration 3
11 Jun to 15 Jun, Duration 3
Starts the working day after A's due, Thu 11 Jun, and keeps its 3 days of work, so it finishes Mon 15 Jun.
C
09 Jun to 11 Jun, Duration 3
16 Jun to 18 Jun, Duration 3
Starts the working day after B's new due, Tue 16 Jun, and finishes Thu 18 Jun.
What you see and what Apply writes
The strip says your change moved 2 work items. The plan's finish moves from 11 Jun to 18 Jun, 5 working days later, so the headline is Finish slipped.
Apply writes A's new due and its Duration 8 (Jira holds a Duration for A), and B's and C's new start and due. B's and C's Durations did not change and are not written.
With a lag of 2 on the A to B link, B would run Mon 15 Jun to Wed 17 Jun and C Thu 18 Jun to Mon 22 Jun.
With a plan holiday on Thu 11 Jun instead, B would run Fri 12 Jun to Tue 16 Jun and C Wed 17 Jun to Fri 19 Jun.
Example 2: a buffer absorbs, then is exhausted
A blocks BUF, and BUF blocks Z. BUF has Buffer = Yes and a due date of Fri 19 Jun in Jira. Two slips are applied to A, one after the other.
Step 1: A's due moves from 03 Jun to 10 Jun
Ticket
Before
After
Why
A (edited)
01 Jun to 03 Jun, Duration 3
01 Jun to 10 Jun, Duration 8
Your edit.
BUF
04 Jun to 19 Jun, Duration 12
11 Jun to 19 Jun, 7 working days
The required start, 11 Jun, is still before the held due, so the due stays 19 Jun and 5 working days of buffer are used.
Z
22 Jun to 23 Jun
22 Jun to 23 Jun
Unchanged. BUF's due did not move.
The strip says 1 work item moved and 1 buffer absorbed it, and the finish does not move, so the headline is Buffer absorbed it. Apply writes A's new due and Duration and BUF's new start. BUF keeps Duration 12 in Jira; the 7 is shown, not written.
Step 2: A's due moves again, from 10 Jun to 19 Jun
Ticket
Before
After
Why
A (edited)
01 Jun to 10 Jun, Duration 8
01 Jun to 19 Jun, Duration 15
Your edit.
BUF
11 Jun to 19 Jun, 7 working days
22 Jun to 22 Jun, 1 working day
The required start, Mon 22 Jun, is after the held due of 19 Jun. The buffer is exhausted and becomes a one-day task.
Z
22 Jun to 23 Jun
23 Jun to 24 Jun
BUF's due moved, so the slip passes through: Z starts the working day after 22 Jun.
The strip says 2 work items moved and shows 1 exhausted; the finish moves 1 working day later, from 23 Jun to 24 Jun. The headline is Buffer spent, with the follow-up "And it still wasn't enough: your finish moved out anyway". On the Timeline BUF changes from amber to violet stripes. Apply writes BUF's new start and due and Z's new dates; BUF's Duration in Jira is left alone.
22The Timeline toolbar, legend and grid
The Timeline tab (it was called Gantt before 4.13.0) has one toolbar row, a legend that is always on screen, and a grid of four columns beside the bars. This lists every control.
Open a plan and choose the Timeline tab in the plan header. The tabs are Timeline, Table, Dashboard, Storyline, Capacity and Reports. Above the bars sit one toolbar row, one legend line and the time scale. Lens, grouping, zoom and folded groups are view settings: they are remembered per plan in your browser and never change the plan.
The toolbar, left to right
Control
What it does
The real plan / Everything / Needs attention N
Which rows you see. Needs attention carries its count on the button, so you know the answer before you click. See the views section.
Group menu
How rows are grouped. Shows Group: Reason (fixed) while Needs attention is on.
Fit / Week / Month / Quarter / Year
The zoom levels. The active one is pressed. Day zoom is in the ⋯ menu.
Today
Scrolls so today sits 200px from the left edge of the timeline.
Sets the finish N
Shows only the chain of work that sets the plan's finish, in chain order, with its own lane under the dates. N is how many items have 0 working days of room. Tooltip: "Sets the finish (critical path): 0 working days of room. On: only the chain, in chain order."
Baseline N moved
Only when the plan has a baseline. Shows or hides the grey baseline bars. N is how many items now finish on a different day than at the baseline.
⋯
More options: Day zoom, Auto-arrange rows (Everything), Show all connectors, and Collapse all groups / Expand all groups when rows are grouped by a field.
Undo and Redo
Undo and Redo are not in this row. They sit in the plan header, beside Save, and work on the Timeline and the Table. See the undo section.
The legend line
Always shown
On track, At risk, Late, Blocked, Done (the five fills) and Sets the finish (the violet outline).
Shown only when the plan has them
Plan moved it from Jira's date, Forecast, not a Jira date, Baseline, Jira due, No dates, Buffer and Exhausted buffer.
Reading it
Every swatch is drawn the way the bars draw it. Hover any word for a one-line explanation. The line ends with "State = fill · each word explained on hover".
The grid beside the bars
Columns
Name, State (a chip in the state's colour), Room (working days of room, for example "12 wd", or "—" when done or not measured) and Finish.
Name column heading
Reads, for example, "Plan · 72 open work items · 17% dated". Hover it for the counts behind the share. In Needs attention it reads "Needs attention · by reason, worst first".
Width
Drag the bar between the grid and the timeline. The grid is 560px by default and can be set from 260px to 900px. The width is remembered in your browser. On a narrow window (1100px or less) the grid keeps only the name and State; on a phone only the key and summary.
NoteOn a phone the same controls wrap onto three rows: zoom becomes a dropdown and the Baseline toggle moves into the ⋯ menu with its count. Nothing is dropped.
23The three views, grouping and the No dates row
The real plan, Everything and Needs attention decide which rows you see; the Group menu decides how they are grouped. None of them changes the plan.
A plan first opens on The real plan, scrolled to the top. The group that holds the first open item on the chain that sets the finish is open, and so is any group that holds a blocked item. Other groups start folded. Your choice of view, grouping and folds is remembered for that plan.
The three views
View
What you see
The real plan
With the default grouping Epic › quarter, three sections: the epics that hold work (one group per top-level parent, with its items inside), then dated work outside an epic grouped by the quarter it finishes (by month when that work spans less than six months), then a No dates section with one folded row for undated work outside an epic.
Everything
Every row, as a plain list or grouped by a field. Epic › quarter is not offered here. Auto-arrange applies in this view.
Needs attention
Rows grouped by reason, worst first, each with a one-line why. The chain lane is shown under the dates.
Group rows in The real plan
Epic group
The epic's summary, its counts (for example "48 work items · 1 done · 2 started · 1 blocked") and a roll-up bar coloured by the worst open state inside it. When the epic's own Jira due date is earlier than its items finish, a black diamond marks Jira's date ("Jira due … · items end …").
Quarter or month group
A roll-up bar with one label: how many items are on the chain (and "sets the finish" for the group that holds the finish), or how many are past due, or the tightest room, for example "tightest: 3 wd room".
Large groups
An open group with more than 12 items shows the 12 with the least room, then a "+ N more · Show all" row.
The No dates row
What it holds
Every work item outside an epic that does not have both a start and a due date in Jira, including epics with no stories yet. They are listed, not hidden.
What it says
The row is called Undated backlog. Its counts read, for example, "30 work items · 4 are epics with no stories yet", plus the most common label when at least a tenth of the items carry it. Across the timeline it says they have no dates, are not in the forecast, and should be given dates or moved out of the plan.
Opening it
Click the row. Up to 50 items show, then "+ N more · Show all".
Placed but undated
An item with no dates in Jira that the schedule places after the work it waits on still counts as undated and sits in this row, but its bar is drawn where the schedule places it.
Needs attention: the reasons, in order
Reason
Included when
Blocked, and on the chain that sets the finish
A blocked item has 0 working days of room. Every working day it stays blocked moves the finish one day.
Blocked
Jira says it is blocked: its status, or its comments as Read the comments read them.
Past its finish date, still open
Its finish is before today, or the forecast puts it past its finish.
Started, and on the chain that sets the finish
In progress with 0 working days of room.
Later than the baseline
It finishes later than at the baseline.
Epic dates disagree with their items
A parent's Jira due date is earlier than its items finish.
Done, but dated in the future
Done in Jira but dated after today.
Dependency loops the schedule ignores
A link closes a loop. Show them highlights the rows; the row names the link the schedule cuts.
Next to run out of room
The open item nearest to joining the chain, when it has 5 working days of room or fewer.
Dates the plan moved away from Jira's
Information only. Not counted in the Needs attention number.
An item can appear under more than one reason. Each reason shows at most 50 rows, then "+ N more · Show all". When you arrive from a tile at the top of the plan (for example Show all under What's late or blocked?), a line reads "Showing N items" with the tile's label and a Show the whole plan button.
The Group menu
Option
Groups by
Epic › quarter
The real plan's own sections (The real plan only).
Status, Type, Priority, Assignee, Epic
That Jira field. Each group shows a span bar over its members.
No grouping
The plain parent and child tree, with expand and collapse chevrons.
AI structure
Named workstreams built by the AI, with Build AI structure / rebuild controls, a strategy picker and a depth control (Segments, Chains, Issues). It uses the AI and is switched off when an administrator turns off AI structure and Storyline. The status words include STALE, Rules updated, Needs a rebuild and Too large to rebuild.
24Zoom, Today and the bands above the bars
The five zoom levels plus Day, what Fit shows, how far you can scroll, every way to move, and the markers row, the weekly in-flight band and the chain lane.
Zoom levels
Level
Pixels per day
Where
Fit (default on first open)
Measured so the whole plan fits the window
Toolbar
Week
14
Toolbar
Month
5
Toolbar
Quarter
2.5
Toolbar
Year
0.6
Toolbar
Day
40
⋯ menu
What Fit shows
The window
The smallest window that holds today, every commitment, the forecast finish and every dated item, padded by 2% of the span and widened to whole months.
Very long plans
Fit can go down to a scale where 30 years fit, and the scale then labels years only.
Remembered
The zoom you pick is remembered per plan in your browser. The year list from earlier versions is gone: Year is a zoom level.
The time scale
Units
The scale picks its unit from the zoom: days at 14px per day or more, weeks from 3.5px, months from 2.2px, quarters below that. Every month and quarter label carries its year, for example "Nov 2027" or "Q1 2027".
Crowding
A label is printed whole or not at all. When labels would overlap, the later one waits until there is room.
Holidays
At Day and Week units a holiday is marked with an amber strip at the foot of the scale. Hover it for the holiday's name.
How far you can scroll
You can scroll three months past each side of the Fit window, so there is room to drag a bar out of it.
Ways to move
Gesture
Result
Mouse wheel
Scrolls the rows.
Shift + wheel
Pans the timeline sideways.
Ctrl or Cmd + wheel
Zooms in or out, keeping the date under the pointer in place.
Today
Scrolls so today is 200px from the left edge.
Dragging near an edge
While you drag a bar, a row or a dependency line close to the edge of the view, the timeline scrolls by itself.
The markers row
Today
"Today · <date>". Hover: the status date the forecast is measured from.
Commitments
Each target from the plan's Targets, as a diamond with its name and date, and a line down through the rows.
Finish
"Forecast finish · <date>" when past-due work pushes the finish, otherwise "Finish · <date>", followed by how many working days it lands after or before the latest commitment, for example "· 4 wd after Go-live". A line runs down through the rows.
Crowded markers
When markers sit close together each one shortens its words before giving them up. The full text is always on hover.
Focus line
When the Timeline opens for a reason (a missed milestone, a loop, a link from another page), a line here says why, with Show it and Dismiss.
The in-flight band
What it shows
A small weekly histogram of open dated work in flight, with a caption such as "peak 12, week of Oct 5, 2026 · volume, not load: Capacity shows load per person".
Where
Desktop only. It is a count of items, not of effort.
The chain lane
When
While Sets the finish is on, and in Needs attention.
What it shows
The whole chain that sets the finish in one row: "The chain that sets the finish · N items · <first start> → <finish>", with how many are blocked and started. When nothing dated is linked to the finish it says so.
Clicking
Click a segment to open that item's card and bring its row into view.
25Bar colours, marks and the hover
A bar's fill is its state: On track, At risk, Late, Blocked or Done. Everything else is a mark on top of the fill, never a second colour.
TipSince 4.13.0 colour means state, not sync status. The old Synced, Draft and Cascaded colours, and the Legend button, are gone. A change you have not applied yet is shown with an amber frame instead.
The fill: what state the item is in (first match wins)
State
Rule
Done
Status category done.
Blocked
Open, and Jira says it is blocked: its status, or its comments as Read the comments read them. Red, with a pause mark.
Late
Open and dated, and its finish is before today, or the forecast puts it past its finish. Red.
At risk
Open, with 5 working days of room or fewer before it moves the plan's finish.
On track
Open and dated, with more room than that, or room not measured.
No dates
No finish date. Never drawn as a bar.
Room
Room is the number of working days an item can slip before the plan's finish moves. An item with 0 working days of room is on the chain that sets the finish.
Marks on top of the fill
Mark
Meaning
Violet outline
Sets the finish: 0 working days of room.
Amber frame
A draft: a change you have staged that is not in Jira yet.
Teal end-cap, hollow diamond and dotted teal line
The schedule places the item away from Jira's date. The hollow diamond sits on Jira's own date.
Pink stripes beside the bar
The forecast for open work past its due date. See the forecast section.
Grey 4px bar under the bar
Where the item was at the baseline, while Baseline is on.
Black diamond and dashed red line
A parent's own Jira due date, when it is earlier than its items finish.
Red ! after the bar
Done, but dated in the future.
Dark underline
Started (in progress).
Amber stripes / violet stripes
A buffer item / a buffer that is used up (one day left).
Labels and hover
The label
At most one label per bar, to its right: the most important reason, for example "0 wd room", "3 wd room" or "Was due Sep 12, 2026; open.". The key is in the grid, not on the bar.
The hover
At most four lines: key and summary; state, status, dates and length in working days (with "draft, not yet in Jira" when staged); the one most important reason; and, while Baseline is on, how far it is from the baseline. A bar held by a predecessor or a start-no-earlier-than hold says so here before you drag.
Milestones
A work item whose start and due are the same day and that is either a Milestone issue type or has a duration of 0 is drawn as a diamond in its state's colour. Parents and buffers are never milestones.
26Clicking, moving and resizing a bar
A click opens the bar's card; a drag moves the bar or changes its length. Nothing reaches Jira until you press Apply.
The bar card (click a bar)
Header
The key (opens the item in Jira), a state chip, a Sets the finish chip when it is on the chain, and a close button.
Dates
The plan's dates, then either "Jira holds the same dates" or what Jira holds, then the baseline date and how many working days it moved.
Room
A sentence such as "0 working days of room. Every working day it slips moves the finish one day later.", "No room: its date has passed and it is still open.", or why room is not measured.
Waits on
Each predecessor with its status and end date, marked "(on the chain)" or "(loop, ignored)".
Next on the chain
The next open item on the chain after this one.
Why this date
A link that expands the full reasoning for the item's dates.
Buttons
Open in Jira, Show the chain (N) (highlights the chain of items that drive this one), Dates… (opens the date editor; read-only for a parent) and Plan vs Jira… when the schedule moved the item away from Jira's dates.
Closing
Escape or the × button.
The date editor (Dates…)
Fields
Start, Due, Duration (days) and Buffer (No / Yes). An orange dot marks a field that differs from Jira. The dates are worked out on the plan's own calendar.
Dependencies
Blocked by and Blocks lists, with × to remove a link and Chain → to open the Dependency Chain viewer (its Show on Gantt button highlights the chain on the Timeline).
Buttons
Clear, Cancel and Apply. This Apply only stages your edit in the plan; the Apply button in the plan header is what writes to Jira.
Parents
Read-only, with a "Rolled up" badge and a "from KEY" chip naming the item that sets each end. Only Close.
Dragging
1Press on the middle of a bar and drag to move it, or press within 6px of either end to change its length.
2While you drag, a preview follows the pointer and the candidate dates, with their year, float beside the bar. The schedule is recalculated once, when you let go.
3Press Escape before letting go to cancel. Nothing is staged.
Move and resize
Move
Resize
What changes
Both dates. The length in working days is kept.
One end, and the length.
Landing on a weekend or holiday
The start snaps to the next working day in the direction you dragged.
That step is refused, so the edge stays on the last working day.
Duration
Not saved by a move.
Saved, counted in working days on the plan's calendar.
LimitSome drags are refused. Parent bars cannot be dragged: their dates roll up from their children. A linked item starts on the day its link sets, so a drag that would start it later is refused with a message telling you to change the link's lag or move the item it waits on. A move earlier than a start-no-earlier-than hold is refused too. People who can only view the plan cannot drag.
Giving an undated item dates
An item with no bar can be scheduled from its row: hover the empty row and a five-day preview follows the pointer (it does not appear over non-working days). Click to give the item a start on that day and five working days of duration.
27Dependencies: drawing, removing and lag
Draw a finish-to-start link between two bars, see it checked before you drop, remove it, and give it a lag in working days.
Drawing a dependency
1Hover the bar that must finish first. A dot appears just past its right end ("Drag to create dependency (this blocks...)").
2Drag from the dot. A line follows the pointer.
3Move over the bar that must wait. The whole bar is the drop zone. A green line and a chip reading "FROM → TO" mean the link will be accepted. A red line and a chip with the reason mean it will be refused.
4Let go to stage the link. Press Escape, or let go over empty space, to cancel.
Why a link is refused
Chip
Meaning
Can't link an issue to itself
You are over the bar you started from.
Already linked
That link exists already.
Would create a cycle
The link would close a loop.
LimitLinks cannot be drawn from or to a parent bar on the Timeline.
Staged links
What happens
A new link is staged, not written. The schedule moves the waiting item at once and the link is drawn dashed until Apply creates it in Jira. Removing a link is staged the same way.
Saved with your edits
Since 4.15.2 a staged link, a staged removal and a lag on a staged link are saved with your other unsaved edits. They survive a reload and show in your other windows.
At Apply
Apply writes new links before the dates that rely on them. If a link cannot be created, the dates that depend on it are not written and the link stays staged.
Which lines are drawn
By default
Only the chain of the bar you clicked, the chain that sets the finish while Sets the finish is on, and links you have staged. Drawing every link on a large plan made the chart unreadable.
Show all connectors
In the ⋯ menu. Draws every link.
Shape
Each line leaves the right end of the first bar and enters the left end of the waiting bar, with the arrowhead pointing into it.
Removing a dependency
1Click a line. A small menu opens showing "FROM blocks TO", with a "staged" badge when the link is not in Jira yet.
2Click Remove link and confirm the dialog "Remove Dependency" ("Remove: FROM blocks TO?") with Remove.
3A message says which item is now free: "Unlinked FROM → TO. TO is now unconstrained." or that it still has other predecessors.
You can also remove a link with the × in the date editor's Blocked by and Blocks lists, or from the Dependency Chain viewer. All three ask the same question.
Setting a lag
Where
The same menu you get by clicking a line: Lag (working days) with − and + buttons. The lowest value is 0.
Effect
The waiting item may start no earlier than the next working day after its predecessor's due date, plus the lag in working days. The plan is recalculated at once.
On an existing Jira link
The lag is saved to the plan as soon as you set it and everyone sees it. Undo does not take it back: change it back in the same menu. If someone else changed that lag after you opened the plan, your change is refused and the message says what they set.
On a staged link
The lag travels with the link and Apply creates the link with it. If a colleague drew the same link with a different lag, Apply asks which to keep: Keep mine or Take theirs.
Belongs to the link
A lag belongs to the Jira link itself. A link removed and drawn again starts with no lag.
Older plans
On a plan whose lags are still being moved to the storage format of 4.14.0 and later, a new lag is refused with a message to try again in a minute or two. Removing a lag still works.
NoteA dependency into a parent, for example an Epic, holds back the parent's children too. A link that closes a loop is ignored by the schedule; Needs attention lists these under Dependency loops the schedule ignores.
28Parent bars, guide lines and the baseline
How parents, their guide lines and the baseline are drawn.
Parent bars
Span
A parent such as an Epic always spans its children: from the earliest start to the latest due underneath it. This is the same span the schedule uses and that Apply writes.
Jira's own due date
When a parent's own Jira due date is earlier than its items finish, a black diamond and a dashed red line show it, and the legend adds Jira due.
Clicking
Opens the card. Dates… shows the read-only rollup with the item that sets each end.
Rollup guide lines
What they show
Thin dashed lines from each end of a parent's bar down to the item that sets that end.
When
Only when that item is shown below the parent.
Turning them off
An administrator can turn off Parent rollup guides in the app's Gantt Display settings.
The baseline
Drawing
While Baseline is on, every dated item has a grey 4px bar under it at its baseline position. The toolbar button reads "Baseline N moved".
Hover
Says where the item was scheduled at the baseline. When the baseline was frozen against Jira's dates rather than the schedule the plan shows, the hover says the gap is not slip.
The card and the hover
Show the baseline date and how many working days the item moved, for example "+3 wd".
Default
On, remembered in your browser. The button only appears when the plan has a baseline.
NoteSince 4.14.3 freezing a baseline no longer records every row as edited, so a fresh baseline reads the plan exactly as it stood.
29Sets the finish, auto-arrange and row order
The chain that sets the finish, how Auto-arrange orders rows, and how to reorder rows by hand.
Sets the finish
What it is
The items with 0 working days of room: if any of them slips one working day, the plan's finish moves one working day. This is the critical path.
Always visible
Their bars carry a violet outline in every view.
The toggle
Sets the finish N shows only those items, in chain order, draws the links between them, and adds the chain lane under the dates. Press it again to return to your view.
Auto-arrange rows (Everything)
Where
In the ⋯ menu. On by default, remembered in your browser.
What it does
Orders rows so dependency lines point forward and stay short. Parents keep their children grouped under them.
What it does not do
It never changes Jira rank, and the Table is not affected.
Reordering rows by hand
1Turn off Auto-arrange rows in the ⋯ menu and use No grouping.
2Drag a row by its grid cell onto another row.
3The move is staged as a rank change for Jira. The row shows a rank-change mark until you apply or discard it. A parent moves with all its children.
4Dropping an item onto one of its own children is refused with "Cannot move X into its own descendant Y".
NoteThe reorder-suggestion banner described in earlier versions of this manual is no longer shown.
30Your change moved N work items, and Why did this move?
After an edit, a strip above the Timeline (and the Table) says what your change did to the rest of the plan. Why did this move? explains each moved item.
When an edit moves other items, a strip appears above the Timeline: "Your change moved N work items". It only describes edits that are still staged. Discard the edit and the strip goes.
What the strip can say
Part
Meaning
Your change moved N work items
How many other items the schedule moved. The item you edited is not counted.
finish slips N working days / finish pulled in N working days
How far your last edit moved the plan's finish.
the finish is N working days later than the saved plan's
Shown instead while you have unsaved edits: your plan's finish compared with the saved plan.
N buffers absorbed / N exhausted
Buffers that soaked up the slip, and buffers used up to one day.
downstream slips N working days
After a change to the plan's calendar or holidays, which has no single edit to explain: the sum of every moved item's slip, not the plan's finish.
Its buttons
Button
What it does
Why did this move?
Opens the explanation. Offered after a single edit.
Details / Hide
Lists the moved items with their key, summary and change in working days, or "absorbed" or "buffer exhausted".
×
Hides this result. The strip returns with the next change.
The Why did this move? dialog
No AI
Every date and number comes from the schedule engine: "Exactly what your edit did — computed from the schedule engine, not guessed."
Your edit
What you did, for example "You moved SHOP-12's start to …", with the dates before and a note when your date was moved to the next working day or the edit was blocked.
Your targets
Each commitment your change moved, before the plan's finish, for example "Go-live moves 2 working days later (… → …): now …". On a plan already past its commitment it says your change does not move your committed dates and how far past it the plan already was.
Totals
Items moved, the plan's finish before and after, buffers absorbed or exhausted, and milestones moved later or earlier.
What this means
One headline whose colour follows the facts: Edit blocked, Milestone slipped, Finish slipped (red at 10 working days or more), Buffer spent, Buffer absorbed it, Milestone earlier, Finish pulled in, or Contained.
Each moved item
Its change and why, for example "now starts … — can't begin until SHOP-8 finishes …", with "+ 3 wd lag" when the link has a lag. When the app cannot name one cause with certainty it says "bound by its predecessors". Parents read "rolled up from its children".
Limit
At most 40 items, the largest moves first ("Showing the 40 largest moves."). The totals always count every item.
31Undo and Redo
Take back your last changes to the plan, up to 50 steps, on the Timeline and the Table.
How to use it
Action
Mac
Windows
Undo
Cmd+Z, or the Undo button in the plan header
Ctrl+Z, or the Undo button
Redo
Shift+Cmd+Z, or the Redo button
Ctrl+Y or Shift+Ctrl+Z, or the Redo button
What a step is
Hover a button to see the step, for example "Undo: move SHOP-12 (moved 14 items)".
One drag is one step, however many items it moved. A change that moves more than 50 items also shows a message "This moved N items." with its own Undo button.
Keys pressed while typing in a field undo the field, not the plan.
Up to 50 steps are kept. On very large plans the oldest steps can be dropped sooner to save memory.
Save does not clear the history: an undo after Save is an ordinary unsaved edit.
LimitUndo only takes back changes that are not in Jira yet. Apply, Discard All, a reload or re-index, and a refresh of the plan start the history over. Your unsaved draft still comes back after a reload, but the list of steps does not. A lag on an existing dependency is saved at once and shared, so Undo does not take it back; the button says "Lag changes are saved at once — change the lag back in its menu". The buttons are closed while another person is writing the plan or another plan operation is running.
32The pink forecast for past-due work
Open work past its due date is forecast to finish after today, and the Timeline shows that extra time as pink stripes beside the bar.
An open item whose due date has passed cannot finish on that date. The forecast places its remaining work after today: from the next working day, taking its remaining estimate, or one working day when it has none. The items after it move with it.
How it looks
Pink stripes
Drawn beside the bar, from the plan's finish for the item to the forecast finish. The word "forecast" is printed when there is room; on a narrow stretch a small arrow mark; on a one-day stub a pink disc with the mark, just past the stub. It shows at every zoom.
Hover
"Forecast, not a Jira date." followed by either that the item is open, was due on its date and cannot finish before the forecast date (with today's date), or that it waits for open work that is past its due.
Legend
Forecast, not a Jira date appears in the legend whenever anything is forecast.
The finish marker
Reads "Forecast finish" when the forecast moves the plan's finish.
The state
The item is Late (red).
NoteThe forecast is never written to Jira and cannot be dragged. The plan's dates, the Table and Apply are unchanged. The same forecast feeds the plan header, the Plans page, the Dashboard, the Plan brief and sponsor reports.
33Rows, hierarchy and large plans
What a row in the grid shows, how expand and collapse work, and what changes on plans with many rows.
A row in the grid
Element
Behaviour
Chevron
Only on parents, in the plain tree (No grouping). Click to expand or collapse.
Key and summary
Click the key to open the item in Jira. Hover for the full summary, type and status.
↑ PARENTKEY chip
The item has a parent in Jira that is not in this plan, so it shows at the top level. Turn on "Include parents" in the plan's sources to bring the parent in.
Lock icon
The item cannot be updated in Jira, or its Duration or Buffer is not stored in Jira.
Rank-change mark
A pending rank change. Apply or discard it from the toolbar.
State, Room, Finish
The three grid columns.
Expand and collapse
Plain tree
All parents start expanded. What you collapse is remembered per plan in your browser and shared with the Table.
Groups
In The real plan and Needs attention, click a group row to open or fold it. Folds are remembered per plan and per view.
Nothing is lost
Folded and hidden items stay in the plan, keep their links and still move the schedule.
Large plans
Aspect
What happens
More than 150 rows
Only the rows in view, plus 8 above and below, are drawn, so scrolling stays smooth.
Dependency lines
A line whose rows are both outside the view is skipped. Long lines that cross the view are kept.
Groups
Open groups show 12 items, and Needs attention 50 per reason, before "+ N more · Show all".
Opening
Since 4.14.0 a large plan asks for its items together with the plan, so the first rows appear sooner.
CarefulA work item with an unreadable Jira date does not break the chart. Its hover names the problem, and the Table marks the date as Not a date.
34The five answers at the top of every plan
The strip of five questions every plan opens on, on every tab: what each one answers, and where it leads.
Since 4.13.0 the top of every plan answers five questions, on every tab: Will we hit the date?, What's late or blocked?, What changed?, Do this next and Can I trust these numbers?. Each gives a short answer and opens the detail behind it. Everything in the strip is computed from the plan. No AI is involved.
The five tiles
Question
What it answers
Where it leads
Will we hit {target}? (No target date yet when the plan has none)
The plan's status word against its commitment, with the gap in working days, weeks or months, for example Late · at least 3 weeks or Tight · 6 days to spare. Under it: how sure, as a chance of making the date and the date the plan is 80% sure of once the simulation has run (How sure: not worked out yet before that), and up to two other targets with their own words.
Click the answer for the why. Depending on the state it offers Scope {target}, Re-plan {target}, Set the release date or Send the final report.
What's late or blocked? · N
Up to three items that are past due, blocked (by their Jira status or by what a comment says) or whose Jira date falls before their own work. A footer line gives the past-due count and the next due item. When nothing is blocked it says what was read, for example No status or comment says Blocked.
Show all N opens the Timeline on exactly the items counted in the title.
What changed?
Since you last looked, otherwise since the baseline: whether the finish moved later or earlier (or Finish unchanged), how many work items moved earlier and later, and how many were edited in Jira. On a first visit with no baseline it reads First visit.
See what moved. Set the baseline now when the plan has no baseline and you can edit it.
Do this next · from your plan, no AI
Up to three next moves: the same list, in the same order, as the Plan brief's next moves. Nothing needs you today when there are none.
Plan brief: why, in full.
Can I trust these numbers?
Yes, Partly or Not yet, how many open work items have usable dates, and the two most serious findings of the Health check.
Open the health check · N findings.
Colours
Colour means one thing across the strip. Red: a date will be missed, was missed, or work is blocked. Amber: tight, or numbers not to trust yet. Green: on track, delivered or trustworthy. Slate: can't tell or not measured. A data problem is never red, so Can I trust these numbers? is amber at worst.
While a refresh or an Apply runs, each tile keeps its last answer, shows the time it is as of, and carries one live line. It never blanks out.
NoteA Blocked that came from a comment note read before 4.13.1, and that the saved words cannot confirm, is not counted in What's late or blocked?. It is listed as unverified with a button that reads the cited comment again from Jira, without AI. The check does not run while AI or Read the comments is switched off, and the tile says so.
35Status words and how much of the plan must be dated
The words a plan can carry (On track, Tight, Late (forecast), Late (at least), Overdue, Can't tell yet, and the rest), the 80% and 50% dated thresholds, and what counts as dated.
Every plan carries one status word. It sits next to the plan's name in the header, and the Plans page, portfolios, the Plan brief and the reports show the same word. The word is about the plan's commitment (its target date), not about single tickets: work items already past their own due date are shown as a separate red line under the word, for example 3 work items past due.
The words
Word
When it shows
On track
The plan has started and finishes more than 10 working days before its target, and at least 80% of the open work is dated.
Not started
The same, but the plan's dated work has not started yet.
Tight
The plan finishes 10 working days or less before its target, the target has not passed, and at least 80% of the open work is dated.
Late (forecast)
The plan is forecast to finish after a target that has not passed yet, with at least 80% of the open work dated. It reads Overdue once the date goes by.
Late (at least)
Less than 80% of the open work is dated, and the dated part alone already finishes after a target that is still ahead. The gap shown is a lower bound: the undated work can only make it later.
Overdue
The target date has passed and work is still open, whatever the last schedule said.
Can't tell yet
Less than 80% of the open work is dated, and the dated part finishes on or before the target (or nothing is dated). The plan would otherwise read On track, Tight or Not started.
No target
The plan has no target, so there is no commitment to measure against. On the Plans page this reads No commitment.
Delivered
Every work item is done.
Not measured
There is no finish date, no work, or the room could not be measured.
What counts as dated
Since 4.14.0 a work item is dated only when it has both a start and a due date. Items missing either are called not fully dated everywhere. The dated share is the open work that has both, as a share of all open work items. It is rounded down, so 100% means every open item is dated. An epic with no stories yet counts as a work item, dated or not. An item whose start is after its due is named as dates that don't fit. An item with no dates of its own, which the schedule only places after the work it waits on, counts as undated.
The two dated thresholds
80% of the open work dated
Below this, a plan cannot read On track, Tight, Not started or Late (forecast). It reads Late (at least) when the dated part already misses the target, otherwise Can't tell yet. The plan header, the Plans page and the Plan brief show the same word. A target's own word reads the dated share of the work items in that target only.
50% of the open work dated
Below this, the plan is Low confidence. On the Plans page its status chip is outlined and the line under it reads, for example, Low confidence · 17% dated. Medium confidence is 50% or more. High confidence needs 90% or more and, when the plan has a commitment, a simulated chance of making it.
On the Plans page
The count above the Plans list puts every plan in one group. Can't judge yet holds every plan that reads Can't tell yet, and every On track, Not started, Tight or Late (forecast) plan on Low confidence. Late (at least) and Overdue are proven from the dated work, so they count as late whatever their confidence, and the count says how many of the late plans rest on low confidence, for example 12 late · 12 of them low confidence.
TipTo move a plan out of Can't tell yet, give the open work in the target's scope a start and a due date, or scope the target to the work that is dated. Will we hit the date? offers Scope {target} for this.
36The Health check
What the Health check lists under Stops the forecast, Says something untrue and Limits what can be judged, the fixes it offers, and the promise that it never writes to Jira.
Open it from Open the health check on Can I trust these numbers?, or from Health check in the plan's ⋯ menu. A side sheet titled Health check · {plan name} asks Can you trust this plan's dates? and answers Yes, Partly or Not yet. It is computed from the plan, with no AI.
The answer
Not yet
Less than 80% of the open work is dated, or at least one finding stops the forecast.
Partly
Nothing stops the forecast, but at least one finding says something untrue.
Yes
Neither of the above.
Under the answer, a summary row counts the findings that stop the forecast, say something untrue and limit what can be judged, the checks that pass, and the share of the open work that is dated, with a bar. When some of the undated items have dates that don't fit, a line splits the undated count into missing a start or a due, and start after due.
The findings
Group
Finding
Fixes offered
Stops the forecast (fix these first)
Undated work in a target
Scope the targets (or Set the release date when there is no target), Show them
Stops the forecast
Dates that don't fit (start after due)
Show them
Stops the forecast
Dependency loops (links that close a loop, which the schedule ignores)
Show the loops
Stops the forecast
Dated work items have no dependency. Listed only when 5% or more of the open dated work has none; under 5% it is a pass.
Show them
Says something untrue (a reader would be misled)
Done, but dated in the future (using the site's own word for done when all items share it)
Show them. When Jira holds a done date for every one: Set their due to the day Jira marked them done
Says something untrue
Epics (or parents) that end later than, or disagree with, their Jira dates
Use the stories' dates, Show them
Says something untrue
Dates the plan moved away from Jira's
Review and Apply, Show them
Limits what can be judged
Epics with no stories yet
Show them
Limits what can be judged
Open work items have nobody assigned (Nobody is assigned when that is true of all of them)
Set up the roster
Limits what can be judged
Work items can't be updated in Jira from this plan, or can't store Duration or Buffer in Jira
See why, and the request for your Jira admin
Limits what can be judged
No baseline
Set the baseline now
Limits what can be judged
No release date
Set the release date
Limits what can be judged
The last refresh from Jira did not complete
Refresh now
Limits what can be judged
Work items are ranked above the work they wait on
Tidy the order
Every fix says what kind it is
Label beside the button
What the fix does
in this app
One click, in the app only. It never writes to Jira.
view only
Changes what the Timeline shows.
you review before Jira
Opens a review of the proposed values. Put them in my draft adds them to your draft; Cancel stages nothing. Nothing reaches Jira until you Apply.
in Jira
Advice for a change only Jira can make, with an Open in Jira link.
Open in Jira opens the finding's own items in Jira search: by key when there are 50 or fewer, otherwise by a condition on the plan's source. Where a search cannot say exactly what the finding counted, a large finding has no link rather than a wrong one. Passes lists every check that found nothing, and Copy as a list puts the whole sheet on the clipboard as plain text.
NoteNothing on the Health check writes to Jira and nothing changes the plan's sources. A fix that changes dates always goes through the review and your draft, then the usual Apply.
LimitBlocked, past-due and due-soon work are not on the Health check. They are delivery facts, shown in What's late or blocked? and the Timeline's Needs attention view.
37The Dashboard: seven questions
What the Dashboard tab shows since 4.13.0, panel by panel, what was removed, and how it behaves while the plan refreshes.
Open a plan and click the Dashboard tab (the tabs are Timeline, Table, Dashboard, Storyline, Capacity and Reports). Since 4.13.0 the Dashboard does not repeat the five answers at the top of the plan. It answers seven questions, all computed from the plan's own rows. Its footer says so: Computed from the plan's own rows. No AI. The Plan brief is the AI read of the same plan.
NoteGone since 4.13.0: the six KPI tiles, the plan health score and its ring, the effort-weighted Complete %, the status donut, the schedule-risk RAG card, the milestone card and the weekly workload heatmap. The risk scores and buffer health that remain are in Model details.
The seven panels
Panel
What it shows
Buttons
Will it land, and when?
A time strip from Today to the release date, the plan's finish and the date 8 in 10 simulated runs make, with the baseline finish when a baseline is set. Under it, one paragraph: the release date, the finish, how many working days before or after it, and the 80% date. When open work is not fully dated, a line says how many open work items the forecast covers and that the rest are not in it. Other targets get a line each.
Depending on the state: Scope the release, What changes the finish?, See the chain on the timeline, Set the release date, Show the N past due, Show the N not fully dated.
How sure is that date?
A score out of 100 from six checks of the plan's own data. See the next section.
One button per way to raise it.
Top risks, and why
Up to five delivery facts, worst first, each with why it matters and the next step. The kinds are Past due, Blocked, Jira promise (a parent whose Jira date falls before its work), Sets the finish, Later than Jira, Buffer used and Due in 5 days. Data problems are left to How sure is that date?.
Open {key}, Show the N, Show the chain, and Show all of them on the timeline.
What moved?
Two lenses: Last look (since your last visit) and Baseline. The finish first, then how many work items moved later or earlier, were added, removed or finished, and why each moved where the plan can prove it.
Set baseline, Update baseline, Clear, See all on the timeline.
What state is the work in?
All work items split into done, started, dated but not started, and not fully dated. The work against today: past due, due in 5 days, blocked, done but dated in the future, open with a due date not yet due, and open with no due date. A pace line compares % done with the share of the dated window that has gone.
Click a segment or a count to show those items.
When does the work land?
Dated work items by the month, quarter or year they are due (the grain depends on how far the dates spread), split into done, past due, started and not started, with the targets marked. Below it: Coming up in the next 30 days.
Who is carrying it?
One line from the Capacity tab's team roster: who is over their hours in the next 12 weeks, in how many weeks, and the worst week.
Set up the team roster, Add hours or Open Capacity.
Model details
Below the panels, Model details holds what a planner tunes: the simulation, risk scores, buffer health and the exports. It is folded by default.
No forecast
When one row has dates the schedule cannot read (a due before its start, or a date that is not a real day), the plan has no forecast. The Dashboard still shows the finish, the release date and the past-due count. It drops the 80% date and the score, and How sure is that date? names the row to fix.
While the plan refreshes from Jira, a line reads Refreshing from Jira: numbers may change in a minute. A plan with no work items shows This plan has no work items yet. Add a source to index work. The only buttons on the page that change anything are the baseline's; everything else opens a view, a panel or the Timeline.
38How sure is that date? The score out of 100
The six checks behind the Dashboard's confidence score, their points, the caps and bands, the trust line, and what the panel tells you to quote.
The score is measured over the commitment's scope when it can be read (Measured over {target}'s scope: N work items open), otherwise over the whole plan. Each check is shown with the count that earned its points. The panel then lists what holds the score back and what would raise it, each with one button. How the score is built opens the rules below. Six checks computed from the plan's own rows. No AI.
The six checks
Check
Points
How it is scored
Work with dates
30
30 × dated open work items ÷ open work items in scope. Dated means a start and a due date.
Work linked in order
15
15 × linked ÷ dated ÷ 0.95. Full points at 95% linked.
Release date can be simulated
15
15 when a release date is set and every work item in its scope is dated.
Dates agree with each other
15
15, minus 5 for each kind present: done work items dated in the future, a parent's Jira date against its children, a dependency loop the schedule ignores.
Work has owners
10
10 × assigned dated work items ÷ dated work items. With a team roster on the Capacity tab, only owners with room in the next 12 weeks count, and the check reads Work has owners with room.
Track record
15
15 × the smaller of weeks of history ÷ 6 and work items finished ÷ 10, the Capacity tab's pace gate.
Caps, bands and the trust line
Caps
While fewer than half of the open work items are dated, the score stops at 39 whatever else is fixed. With no track record it stops at 84. A due before its start, or a date that is not a real day, gives no score at all.
Bands
Low 0 to 39, Fair 40 to 64, Good 65 to 84, High 85 to 100.
Trust line
65. Above it, the 80% date is safe to quote.
The quote line
Band
What the panel tells you to quote
Low
Don't quote a date yet. If asked: "not before {80% date}", and say it covers {dated share} of the open work.
Fair
Quote the 80% date, not the plan's finish (or both, when they agree, with a note that the inputs are thin).
Good
Safe to quote the 80% date.
High
Safe to quote the 80% date, with how many working days separate it from the plan date.
What would raise it
What would raise it: Scope the release (when the release is only the dated work), Show the N (to date, link and assign the undated backlog), Set the release date, Show the N that have no dependency, Show them (contradictions), Show unassigned, and, with a roster, Show the N held by people over their hours, which opens Capacity.
LimitThe score measures the inputs to the forecast. It never says a plan is on track: that is the status word's job. The old health score is gone.
39% done is a plain count
How % done and the plan's size are counted since 4.14.0, and how the pace line reads.
Since 4.14.0, % done is the share of work items that are done. Each work item counts once, whatever its size or status, an epic with no stories yet included. It used to be an average weighted by each item's status and length, so it can read very differently from older versions. A share under 1% reads under 1%, so % done never reads 0% while some work is done. Model details repeats the rule under How "done" is counted.
The plan's size
The plan header, the Plans page and the Timeline give a plan's size as its open work items, for example 72 open work items. Hovering it shows the done work, the total, and the epics that hold stories, which are not counted themselves. Every count of the plan says work items and, from 1,000, uses a thousands separator. The Table counts its rows as rows.
The pace line
What state is the work in? prints % done beside the share of the dated window that has gone, for example 8% done with 40% of the time gone. When the dated work's first start is still ahead, it says so and how many work items are already done and started. With no dated window it says there is nothing to compare.
40Model details
The folded section at the foot of the Dashboard: the simulation, what changes the finish, risk scores, buffer health and the exports.
Model details sits under the seven panels, folded by default (For the planner. Folded by default.). Whether you left it open is remembered in your browser. Opening What changes the finish? from Will it land, and when? unfolds it and scrolls to that part.
Forecast and simulation. Work item uncertainty: Low −10% / +15%, Medium −15% / +35% or High −20% / +60%, starting from the plan's own setting. Then the planned (or forecast) finish with the share of runs that finish by it, P50, P80 and P90, a histogram of simulated finishes in 7-day windows, simulated finishes by target, and each work item's finish spread (P90 − P10, in working days). A coverage list names items left out for a missing start or due date, an invalid date, or a due before its start. The panel says the model is not calibrated against past delivery: its percentages are conditional on the model, not delivery guarantees.
What changes the finish? How much a one-day change would move the finish.
Schedule-risk scores. A score per work item from slip, deadline and buffer, amplified by chain depth. Depth never scores on its own: a long chain only raises the risk of an item that has slipped, is past due, is due within five days or has used up its buffer. High is 60 or more, Medium 30 to 59, Low under 30, and the six highest are listed. Shown only when at least one item is High or Medium.
Buffer health. Only when the plan has buffers: each buffer with N of M working days left, or used up.
How "done" is counted. The plain-count rule from the previous section.
Exports. Export CSV and Health report, described below.
41Saved and unsaved numbers
Where your unsaved edits are counted, where everyone else's view of the saved plan shows, and how the page tells the two apart.
Since 4.14.0 your unsaved edits are counted only on the plan page you are editing: in the five answers, the Dashboard, the Timeline, the Storyline and the Health check. The Plans page, portfolios, reports and everyone else see the saved plan until you Save.
The status word in the plan header stays on the saved plan and reads Saved: {word} until you save.
Will we hit the date? adds a line such as If you save your 2 unsaved edits, everyone sees this. The saved plan finishes Oct 12, 2026; your changes move it 10 working days later.
What changed? says Saved plan: when it describes the saved plan since your last look.
On the Dashboard every measuring panel gets a dashed frame, and a line reads Measured with your N unsaved edits. with As saved: and the saved word beside it.
NoteSave shares your edits with everyone who can open the plan. Apply is what writes to Jira. While the plan holds changes you have not applied, Save and Apply appear on every tab.
42Baselines
How to set, replace and clear a baseline, everywhere it shows (What moved?, Baseline N moved on the Timeline, the vs baseline column), and how to compare captures.
A baseline freezes the plan's schedule so later movement can be measured. The plan's owner or an editor can set one. Since 4.14.3 freezing records the plan exactly as it stood, so a new baseline shows no moves that never happened.
Setting one
Dashboard, What moved?: Set baseline when there is none, then Update baseline and Clear.
What changed? at the top of the plan: Set the baseline now on a plan with no baseline.
Health check, No baseline: Set the baseline now.
Reports, Scenarios & history (also Plan settings, Scenarios): Capture working plan with Record type Baseline, then select the capture and click Use as baseline. Earlier captures stay in history.
A baseline set from the Dashboard, the strip or the Health check is kept as a capture named Baseline {date and time}, next to the ones you capture by hand.
Where the baseline shows
Where
What it shows
What changed?
Since the baseline, when you have no last look: finish later or earlier, and how many work items moved.
Dashboard, What moved?, Baseline lens
The finish first, then later, earlier, added, removed and finished. Each row says why it moved where the plan can prove it: pushed by {key}, now on its Jira date, moved by the plan; Jira says {date}, or added since. A line says whether the moved items are on the chain that sets the finish.
Dashboard, Will it land, and when?
A Baseline finish marker on the time strip.
Timeline toolbar
Baseline N moved. Click it to draw grey bars under the bars, where each item was when the baseline was set. A bar's hover adds Baseline: +N wd.
Table, vs baseline column
The shown finish against the baseline's, in working days: +N in red is later, −N in green is earlier, 0 is unchanged, and a dash means the baseline does not track that row.
Sponsor reports
A capture keeps a separate copy of the active baseline.
Comparing captures and forecasts
In Reports, Scenarios & history, select a capture to see Captured schedule → working schedule: each changed row with its Start, Finish, Duration and Buffer from and to, and the counts of changed schedules, rows added to and removed from the working plan. Use as comparison basis on one capture, then select another to compare the two. Calculate captured forecast runs the simulation on the captured schedule. Under Forecast outcomes, Record working forecast keeps a forecast so it can later be compared with when Jira resolved the work.
LimitA baseline stores plan dates only. What moved? never claims Jira changed a date; where the cause is not recorded it says so.
43Targets and scenarios
Where targets and scenarios live, and how the Dashboard's buttons reach them.
Targets
Plan settings, Targets opens the plan's targets. A target compares a date with the whole plan, an epic or a release, and a scoped forecast keeps every dependency. A target's own confidence reads the dated share of the work items in it. The Dashboard's Scope the release and Set the release date open Targets; they never change a target themselves. Since 4.15.4, if a change made from Scope the release would leave the plan without a release date, Targets asks first.
Scenarios
Plan settings, Scenarios opens Scenarios & history. Capture working plan with Record type Scenario keeps an alternative. On a capture, Create alternative saves an edited copy as a separate scenario, Adopt schedule… puts its dates, durations and buffers into your working draft after you confirm (review it on the Timeline or Table, then Apply), Open as private simulation… forks it into a simulation plan, and Delete capture removes it.
44Who is carrying it? and the team roster
The Dashboard's workload line, the shared team roster on the Capacity tab that feeds it, and what each state says.
The weekly workload heatmap is gone. Who is carrying it? now reads the Capacity tab's own model for the next 12 weeks, so the Dashboard and Capacity always agree.
The team roster
Each plan has one shared team roster. On the Capacity tab, an editor clicks Set up the team roster (later Edit the team roster), uses Add a person from Jira, and sets each person's Hours a week: their whole working week, not only this plan. Optional fields are On the plan from, Until and Days off, plus Hours in a working day on this plan. Save roster shares it: everyone who can view the plan sees the same hours. Nothing on the roster is written to Jira or moves a date. Finding people needs Jira's Browse users and groups permission.
State
What the line says
Nobody assigned
Nobody is assigned on any of the N open, so workload can't be judged. Button: Set up the team roster.
No hours set
N people carry the dated work, but no hours are set, so no week is judged. Button: Add hours.
Roster with hours
Who is over their hours, in how many of the next 12 weeks, and their peak week, for example: Ana is over their hours in 3 of the next 12 weeks (peak 52 h of 40 h, week of Nov 2, 2026). Or: Nobody on the roster is over their hours in the next 12 weeks. Button: Open Capacity.
Simulation plan
A simulation has no roster of its own, so no week is judged here.
NoteWith hours set, How sure is that date? counts only owners with room in the next 12 weeks, so work held by someone over their hours lowers the score.
45The two CSV exports
Export CSV and Health report: where they are, their columns and filenames, and the column that is always blank.
Export CSV is in the plan's ⋯ menu and under Exports in Model details. Health report is only in Model details. Both carry Jira's dates and the plan's scheduled dates side by side, because every Dashboard number is measured on the scheduled dates.
Export CSV: plan-{plan id}-{YYYY-MM-DD}.csv
Column
Content
key, summary, type, status
The work item.
jiraStartDate, jiraDueDate
The dates Jira holds. Blank when Jira holds none.
settledStartDate, settledDueDate
The dates the plan schedules, with its dependencies applied.
schedule
as in Jira, derived (the plan's dates differ from Jira's) or not in Jira.
duration, buffer, assigneeName, parentKey
From the plan's row.
Health report: plan-health-{plan id}-{YYYY-MM-DD}.csv
Column
Content
key, summary, status
The work item.
jiraDueDate, settledDueDate, schedule
As in Export CSV.
riskScore, riskBand
The schedule-risk score and its band (red, amber or green for High, Medium and Low).
baselineSlipDays
Always blank in this version.
bufferHealthPct, bufferExhausted
For buffers only: the share left, and yes or no.
NoteA cell that starts with =, +, - or @ is written as text, so a spreadsheet never runs it as a formula.
46Table: columns
The columns the Table opens on, what Status, Room, vs baseline, Waits on and Flags mean, the optional columns, and what is remembered.
Since 4.13.0 the Table opens on the columns a scheduler reads first. Key and Summary come first, then Status, Start, Finish, Room, vs baseline, Waits on and Flags. These are always shown. Every date carries its year.
The default columns
Column
What it shows
Status
On track, At risk (5 working days of room or fewer), Late, Blocked, Done or No dates. A parent row shows the worst state of its open work.
Start, Finish
The scheduled dates. A date the schedule moved away from Jira's is set in bold teal; Flags then says Jira's own date. Finish is bold.
Room
Working days the item can slip before the plan's finish moves, in wd. 0 means it sets the finish. A late item reads late. Done and undated work show a dash. A parent shows the tightest room of its open work.
vs baseline
The finish against the baseline's, in working days: +N later, −N earlier, 0, or a dash when not tracked.
Waits on
The items it waits on, the one whose finish sets its start first. Two are shown, the rest behind +N. A link the schedule ignores because it closes a loop is marked loop.
Flags
Blocked, Done, but dated in the future, Sets the finish (a parent says how many of its items do), Jira due {date} for a parent whose Jira due falls before its work, Jira: {date} for a date the plan moved from Jira's, and Past due. Two show in the cell, the rest behind +N; hover for all of them.
Optional columns, under Columns
Group
Columns
Schedule
Duration, Buffer, Jira start, Jira finish
Issue
Type, Priority, Resolution, Labels
People
Assignee, Reporter
Hierarchy
Parent, WBS
Dependencies
Blocked By, Blocks
Estimation
Story Points
Dates
Created, Updated
Duration and Buffer moved from the defaults into Columns in 4.13.0 and still edit as before. The Columns button shows how many optional columns are on. The chosen columns, the sort, the Summary width and the order (Plan order or Jira rank) are remembered in your browser, for every plan.
47Table: order, sorting, filter and grouping
The default plan order, sorting by column, the quick filter, group-by, and how big plans stay fast.
Default order
Rows are listed by finish date within each level of the tree, undated work last. Rows with the same finish keep Jira's rank between them. A line above the rows says the order in use: Plan order: finish date, undated last, with links to Jira rank, Sort by room and Sort by finish, and the reminder Room = working days an item can slip before the plan's finish moves.
Sorting
Click a column header to sort by it; click again to reverse. An arrow marks the sorted column and the line reads, for example, Sorted by room (tightest first). Plan order goes back.
Empty values sort last in both directions.
Status sorts worst first: Blocked, Late, At risk, On track, No dates, Done.
Room sorts tightest first, and a late item comes before one with zero room.
Flags sorts by the most urgent flag a row carries.
Filter
Type in Filter work items… to match a row's key, words, status, labels or flags. Clear filter empties it.
Group
Group offers No grouping, Status, Type, Priority, Assignee, Parent and Buffer, any Assets fields the plan uses (as Assets: {field}), and AI structure. While grouped, the tree is flat and rows are in Jira rank within each group. Show children expands every parent at once.
NoteOn big plans only the rows on screen are drawn, so the Table scrolls smoothly whatever its size.
48Table: selection, bulk edit and inline edit
Select rows and the bulk bar, editing Start, Finish, Duration and Buffer in a cell, what the cell marks mean, and Undo.
Select rows and the bulk bar
1Click Select rows. A checkbox column appears, with a header box that selects all visible rows.
2Tick the rows. A bar appears at the bottom: N selected.
3Use Adopt derived dates (N) to review the dates the schedule moved on the selected rows (only when the selection holds such rows; done rows are not offered), or Set buffer Yes or No.
4Clear drops the selection. Done selecting leaves Select mode, which also drops it.
A bulk Set buffer leaves out rows that cannot store Buffer in Jira and says how many in a warning.
Editing in a cell
Start or Finish: click the cell to pick a date. A new Start moves the item and keeps its work, so the finish follows. A new Finish keeps the start and changes the duration. An empty date shows a dash, and Click to set on hover. A Jira date the plan cannot read is marked Not a date, with the reason.
Duration (under Columns): click, type whole working days, press Enter. 0 declares a milestone; an empty value clears it. A change Jira cannot store is refused with the reason.
Buffer (under Columns): click to switch between Buffer and No.
Parent rows are read-only. Their dates roll up from their children: Dates roll up from this issue's children. Edit a child to change them. Buffer is a leaf-task setting.
Marks, Save and Undo
A cell with an unapplied edit has an amber outline. Edits go into your draft: Save shares them, Apply writes them to Jira. Undo and Redo work on the Table as on the Timeline: Cmd+Z (Ctrl+Z on Windows) and Shift+Cmd+Z (Ctrl+Y or Shift+Ctrl+Z), up to 50 steps, for changes not yet in Jira.
LimitViewers without edit access see the same Table with no Select rows and no editable cells.
49Unsaved, saved, applied: the three states of an edit
Edits start in your browser and your private draft, become shared when you Save, and reach Jira only when you Apply.
Nothing you do on the Timeline or in the Table contacts Jira. Dragging a bar, typing a date, drawing or removing a dependency, setting a lag on a dependency you have drawn, or dragging a row to a new rank all stay inside the app until you press Apply and confirm the review.
The three states
State
Where the change lives
Who sees it
What puts it there
Unsaved
On your screen and in your private draft, which the app saves a moment after each edit
You, in every window you have the plan open in
Any edit
Saved
In the plan itself
Everyone who opens the plan, including the Plans page, portfolios and reports
The Save button
Applied
In the Jira issues
Everyone, in Jira
Apply, then the Apply button in the Review Changes dialog
Two buttons, two different counts
Save (N)
Rows edited since the last Save, plus staged dependency changes that are not in your draft yet. With nothing to save the button reads Saved. Hover it for what the count holds.
Apply N changes
Every row whose dates, Duration or Buffer differ from Jira, saved or not and whoever saved it, plus each dependency you added or removed and each rank move. It only appears while that total is above 0. Saving does not lower it; only an Apply or a discard does.
NoteSo Save (1) beside Apply 3 changes is a normal pair: one row edited since the last Save, and three changes Jira does not have yet.
Where the buttons are
Save and Apply sit in the plan header on the Timeline and the Table, and on every other tab while the plan holds changes you have not applied, so a fix adopted from the Health check, the Storyline or the Dashboard can be saved and applied from where you are. Discard All is in the Apply review. Someone with read-only access sees Read only instead: saving, drafts and Apply all need the plan's editor role.
The exception: a lag on an existing dependency
Setting a lag on a dependency that is already in Jira is not staged. The lag is saved to the plan at once, shared with everyone, and the schedule re-settles on it. If the save fails, only that lag goes back and you are told the lag could not be saved. If someone else changed that lag since you opened the plan, your change is refused and their value is shown. Jira issue links carry no lag, so a lag never reaches Jira; the dates it moves are staged and go to Jira with your next Apply. A lag on a dependency you have drawn but not applied is different: it travels with that staged dependency and is saved when Apply creates the link.
50What Save does
Save puts your edited rows into the shared plan. It never writes to Jira, and it never runs by itself.
Save is a button, not a timer. Your edits are protected without it, because your private draft is saved automatically (see Drafts). Save is the moment your edits become part of the plan everyone else sees.
What one Save does
1The button shows a spinner and reads Saving...
2Each edited row's start, due, Duration and Buffer are stored in the plan. Each row also records which of your staged, unapplied dependencies its dates were computed for, so nobody else's Apply writes those dates without the dependency (see Dates held for a colleague's dependency).
3Staged dependency changes stay in your draft. They live in Jira, not in the plan, so only Apply writes them.
4A message confirms it, for example Saved 3 work items to plan, and the button reads Saved. Hovering Saved shows when, for example Saved just now or Saved 2m ago.
CarefulA row that is not in the plan's index yet, usually an issue created since the last refresh from Jira, is not saved. You are told how many and asked to re-index the plan.
Saved edits and Refresh from Jira now
Refresh from Jira now (in the plan's ⋯ menu) keeps edits you saved but have not applied. Where Jira itself has changed the same field since, Jira's value wins, your edit on that field is dropped and the app names the drop. When the plan holds rows edited but not applied, the app asks first in a Re-index plan dialog. Your unsaved edits come back on top from your draft.
NoteSave is closed, with a lock, while the plan is being written to Jira by someone else or by you in another window. Your edits stay on screen and in your draft, and Save opens again by itself when that write finishes.
51Drafts: your unsaved work, and everyone else's
A private, automatically saved draft keeps your unsaved edits and staged dependencies across reloads, refreshes and windows.
A draft is not a Save. Save shares your edits in the plan; your draft is your private copy of everything you have not saved or applied yet. It exists so a reload, a closed tab or a refresh from Jira cannot lose your work.
How your draft works
Aspect
Behaviour
When it is saved
About 1.5 seconds after your last edit, while you have unsaved work
What it holds
Each unsaved row's start, due, Duration and Buffer, and since 4.15.2 every dependency you drew or removed, with its lag
What it does not hold
Rank moves. They stay on the page until you apply them, so a reload loses them
Limit
500 staged dependency changes. Past that the app asks you to apply or discard some before staging more
Who sees it
Only you, in every window where you have the plan open
When it goes
When nothing unsaved or staged is left, for example after an Apply or Discard All (staged dependencies keep the draft after a Save). A draft older than 24 hours is removed by the hourly housekeeping
After a reload
When you open the plan, the app reads your draft back and lays your edits and staged dependencies over the plan, and Save (N) shows the same count as before. While it reads, the plan shows Checking your saved draft. If you reload while a staged dependency change is only on the page and not in your draft yet, the browser asks first.
Other people's drafts
On the Timeline and the Table the header shows a count such as 2 other drafts when colleagues have unsaved work on the plan. Hover it for who, and how many work items each draft touches. Your own draft is never counted.
Out-of-date drafts
When someone applies changes to Jira, every other person's draft that touches the issues they wrote is marked out of date. An out-of-date draft is not laid back over the plan, so you never re-apply edits that were made against dates Jira no longer holds. It is removed at the next hourly housekeeping.
52The Review Changes dialog
Apply first opens a review of every change, with what it does to your commitments, so nothing is written until you confirm.
Pressing Apply N changes writes nothing. It opens Review Changes, the list of what will be sent to Jira. The subtitle counts it, for example 12 changes will be written to Jira, and adds what is left out and why: excluded because Jira can't store it, excluded because your Jira account may not change it, waiting for a dependency a colleague staged, left out with the change that moved it, and (N discarded) for rows you unticked.
First line: your commitments
The top block, What this does to your commitments, is computed by the app from your plan, not by the AI, and is marked Computed. Each commitment the Apply moves gets its status word and a sentence such as Public launch moves 5 working days later, with the dates before and after and the room left. When none moves it says No commitment moves, or for a plan without commitments how the plan finish moves.
The sections, in order
Section
What it lists
What a row shows
Date Changes
Rows whose start or due date changes
Key, summary, and one chip per changed field
Other Changes
Rows where only Duration or Buffer changes
Key, summary, and the changed field
New Dependencies
Dependencies you drew
FROM blocks TO, the lag chip, and already in Jira when Jira holds that link and only its lag changes
Removed Dependencies
Jira links you removed
FROM blocks TO, with blocks struck through in red
Rank Changes
Rows you dragged to a new rank
Key, then before X or after Y
Each section header shows how many of its rows are ticked out of the total, for example 4/5. A date chip shows the old value struck through, then the new one, each with its year: Start: Mar 3, 2027 Mar 10, 2027, with the first date struck through. An empty old value reads none. Duration reads Dur: 5 → 8d and Buffer reads Buffer: No → Yes. The lag chip on a new dependency reads No lag or Lag 3 working days, and a changed lag reads Lag 2 → 3 working days.
Notes that can appear under a row
partial (orange): Duration or Buffer won't be stored on this issue, because the project does not have that field. The dates are still written.
blocked (red): Jira won't accept this change. The row starts unticked; you can tick it back on.
not allowed (red): your own Jira account may not make this change (see Jira permissions). Locked off.
waiting (violet): the row's saved dates wait for a dependency a colleague staged (see Dates held for a colleague's dependency). Locked off.
A line when the dates on screen differ from what will be written, for example because a lag or the schedule moved the row.
A line when a due date falls on a non-working day, for example Sat Oct 10 is not a working day on this plan's calendar: the work ends Fri Oct 9, and anything it blocks starts no earlier than Mon Oct 12.
Unticking a row
Click a row's tick box to leave it out. The Apply button counts down as you go and is disabled when nothing is ticked. Leaving a change out also leaves out the dates only that change moved: those rows are locked and say so, for example The dates this dependency would have moved are left out too. A row that another change you are writing also moves is recalculated without the one left out.
CarefulUnticking is a discard, not a postponement. When you apply the rest, an unticked date row goes back to what Jira holds, in the plan as well as on screen, and an unticked dependency or rank move is dropped. To keep an edit for later, close the review with Cancel instead.
The footer buttons
Discard All
Throws away every pending change of yours: your rows go back to Jira's values in the plan, your staged dependencies and rank moves are cleared and your draft is deleted. Rows held for a colleague's staged dependency are kept as saved, and the message says how many. If leaving the plan right after, the app finishes the discard first.
Review with AI
Shown when AI is on for the site. Opens AI Plan Review on top of the dialog (see below). It never changes your plan.
Cancel
Closes the review and keeps everything staged. Escape does the same, unless AI Plan Review is open on top.
Apply N Changes
Confirms and starts the write.
Review with AI
AI Plan Review is advisory, not a gate. It repeats the commitments block, states what this Apply does (This Apply, computed from your staged changes), then shows Checked by the app: dependency loops the schedule ignores, parents whose Jira dates disagree with their children, and any staged change that doubles or halves a task's length by 10 working days or more. The AI's own findings come after, checked against your dates and calendar: findings the plan's dates disprove are dropped and ones it cannot prove are shown as MEDIUM. It says how many issues it read. Each finding offers Open with the issue key, and on rows you edited, Undo with the key, which unticks that row in this Apply. A reused result is marked Saved review. When the daily or monthly cap is reached it says so, for example Daily AI review limit reached, and adds that you can still apply. An administrator can switch Review with AI off on the AI features card in Settings, Maintenance.
53Your own Jira permissions decide what Apply may write
Since 4.12.1 the app asks Jira, issue by issue, whether your own Jira account could make each change, before the review and again before each write.
Apply writes to Jira as the app, but only where you could make the change in Jira yourself. Being an editor of the plan is not enough.
What each change needs
Change
Jira permissions on the issue
Start, Duration or Buffer
Edit Issues
Jira's Due date
Edit Issues and Schedule Issues
Add a dependency
Link Issues on both issues
Remove a dependency
Link Issues on at least one of the two issues
Rank change
Edit Issues and Schedule Issues on every issue moved
Any of the above
Browse Projects on the issues it touches
In the review
The review asks Jira when it opens. A refused row is unticked, cannot be ticked back on, and carries a red not allowed label naming the missing permission, for example not allowed: Your Jira account may not edit SHOP-12 (Jira's Schedule Issues permission), so nothing will be written for it. The rest of the Apply goes ahead, and your edits on refused rows go back to what Jira holds.
CarefulIf Jira does not answer, the review says Jira could not confirm what your Jira account may change and leaves every row in. The same happens if you press Apply before the answer arrives. A refused row then stops the Apply: dates stop before any is written, and dependencies and rank changes stop at that row. Open the review again and apply.
At the moment of each write
The check is made again just before each issue is written. If your permission was taken away after the review, for example while an Apply was stopped, the Apply stops at that issue without writing it and names it with the missing permission. You can then resume once the permission is given back, or end the Apply (see When an Apply stops partway).
54Dates held for a colleague's unapplied dependency
Since 4.15.3 your Apply never writes dates a colleague saved for a dependency that only exists in their unapplied edits.
A colleague can draw a dependency, let the schedule move the dates behind it, and Save those dates without applying the dependency. The dates are now in the shared plan, but Jira does not have the link they were computed for. If you applied them, Jira would receive a schedule built on a link it does not have. So your Apply holds those rows back.
What you see
The subtitle counts them, for example 2 waiting for a dependency a colleague staged.
Each held row is locked off with a violet waiting label that names the dependency, who staged it, and the ways on.
Rows that only the held row moved are left out with it.
How a hold ends
By itself, when your colleague applies or discards the dependency.
You draw the same dependency at the same lag and apply it with these dates.
Someone who can edit the plan presses Release on the row. A confirmation dialog, Release saved dates, says Apply will then write the dates without that dependency and that the release is recorded in the plan's audit log under their name.
NoteHolding never undoes anything. Your Apply and your Discard All leave a colleague's saved dates exactly as they are.
55Two lags for one link: Keep mine or Take theirs
When a colleague gives a link you have staged a different lag, Apply asks which lag the link keeps before writing anything.
If a colleague draws a link you have staged, or sets a lag on it, with a lag different from yours, the plan shows their lag and tells you once that Apply will ask which to keep. The next time you press Apply, a dialog titled Two lags for one link names the link, both lags and who set theirs.
Keep mine (3 working days)
Saves your lag over theirs, but only if nobody changed it again since you were asked. If they did, you are asked again on the new value.
Take theirs (5 working days)
Drops your staged lag. The schedule re-settles on their lag. If the link has meanwhile gone from Jira, your staged link is restaged on your own lag and you are told so.
Escape
Decides nothing. Apply writes nothing until you choose, so no date is ever written on a lag the link does not have.
After you choose, the app says the lag is settled and asks you to press Apply again. The same guard runs when you confirm the review: if a link or lag you staged changed while the review was open, or the app cannot reach Jira to check, nothing is written and you are asked to review again.
56Apply: what happens to your Jira issues
Links first, then dates, then rank moves; every issue checked and written one at a time, with live progress, then read back from Jira.
From confirm to Applied
1Your draft is bound to the review you confirmed, so newer edits from another window cannot slip into this Apply.
2The shared schedule check runs (see Conflict detection).
3New and removed dependencies are written first, because the dates were computed for them. The progress dialog says links first, then your dates, and names each one, for example Link SHOP-1 → SHOP-2, lag 3 working days. If any of them fails, no dates are written and the failed links stay staged.
4Dates are written one issue at a time. Before each issue the app checks your Jira permission, re-reads the issue from Jira, and stops if the field changed in Jira since your plan last read it. Duration or Buffer that the project cannot store is dropped from that issue's write and the dates still go.
5Verifying: every written issue is read back from Jira and compared with what was sent.
6Refreshing the plan: the written issues are refreshed into the plan, other people's drafts that touch them are marked out of date, and the plan version goes up.
7Rank moves are written last.
8The dialog reads Applied with how many were written, and the plan behind it refreshes at once.
Watching the progress
Since 4.15.2 the progress climbs issue by issue. A stepper shows Starting, Writing, Verifying and Complete. While writing, the title reads Writing to Jira with, for example, 34 of 120 issues written to Jira, the line below names the issue being written (Writing SHOP-12 · 35 of 120), the keys already written appear as green chips, and a clock shows the time taken and when the app last heard from the server. The plan header shows the same count.
When Applied appears
Applied says how many issues were written, then where the plan now stands against its commitment, for example Plan now 2 working days past Go-live, with Before this Apply and the earlier standing when that changed. Press Done to close it.
When another Apply is finishing
If another Apply on the plan is still finishing when you press Apply, yours does not stop. It waits and tries again by itself for about two minutes, and says so: Another operation on this plan is in progress. Retrying automatically, with the attempt number. Cancel stops the waiting and sends nothing.
Fields written
In the app
In Jira
Start
The start date field set in the app's field settings (Jira's Start date by default)
Due
Jira's Due date
Duration
The Duration field set in the field settings
Buffer
The Buffer field set in the field settings
Dependency
An issue link of the configured type (Blocks by default), the predecessor as the blocker
Rank
Jira's rank
What Apply writes and what it leaves alone
What you changed, and the dates your change pushes on tickets that already have dates in Jira.
Not values the schedule only works out: an Epic end no child holds, how much of a buffer was used, a due date shown only because a ticket has a start and a Duration, or a Duration nobody typed. The review notes a Duration it deliberately does not write.
Never a Done ticket, unless you edited it yourself.
A summary row such as an Epic always spans its children in what is written.
CarefulWrites are made by the app with notifications turned off, so Jira's issue history names the app and watchers get no email. The app's audit log records which person applied which issues; a Jira administrator reads it through the REST API.
57When an Apply stops partway
Nothing already written is rolled back or sent twice. A stopped Apply can be resumed, or ended with what it wrote.
CarefulAn Apply is not a transaction. If it stops at issue 40 of 60, the first 39 are in Jira and stay there. What the app guarantees is that you see exactly where it stopped and that no issue is ever written twice.
An Apply stops when an issue's permission check fails, when an issue changed in Jira before it was written, when Jira did not keep a value it was sent, when a colleague's hold applies on resume, or when the connection breaks. The dialog then reads Apply stopped, names the issue and the reason, and a WHAT HAPPENS NEXT box says how many issues are already in Jira and what each button does.
Your options
Resume saved Apply
Carries on from where it stopped, from the review you confirmed then. Issues already in Jira are not sent again.
End Apply here
Offered once something was written. Keeps what is in Jira, writes nothing more and closes the Apply so the plan is free again. Edits it did not write stay as unapplied edits for you to apply later. The dialog then reads Apply ended.
Discard and apply current edits
Offered only when the earlier Apply wrote nothing. Drops it and applies what you have now.
Close and keep progress
Leaves everything as it is. Your edits stay saved.
NoteIf the app cannot read back how far the Apply got, it says that some of the issues may already be in Jira and offers only Resume saved Apply, which reads the saved progress first. It never guesses a count.
Interrupted Applies
If the window running an Apply is reloaded or closed, your other windows of the plan show Apply interrupted at once, and the header offers Resume interrupted Apply. Hover it to see how many issues are already in Jira. Resume finishes the Apply you confirmed then, not the edits on screen now. If you press Apply while an earlier Apply of yours is unfinished, the dialog reads Earlier Apply found and offers the same choices.
Cancel while writing
Cancel stops after the request in flight; the button reads Stopping after the current request while it does. Whatever was already written stays in Jira.
Dependency and rank failures
A dependency, removal or rank move that Jira refuses stays staged, and the message tells you to apply again to retry. A dependency created whose lag could not be saved stays staged with its lag, and applying again saves it. When only dependencies and rank moves are applied, the dialog offers Stop after current request instead of Cancel and ends on Complete.
LimitWhen a project cannot store Duration or Buffer, Applied adds that Jira kept the scheduling fields it could, and that your intended values and draft are kept.
58The write lock and what other people see
One writer at a time per plan. Everyone else sees who is writing, and the lock frees itself if a writer disappears.
Writing dates takes an exclusive write lock on the plan, so two people cannot write over each other. The lock lasts 5 minutes and is renewed while the Apply runs. If the writer's window disappears, the lock expires and the next person can apply. The hourly refresh from Jira skips a plan while it is being written.
What other people see
Anyone else with the plan open gets an overlay titled Plan is being written: the writer's name is writing changes to Jira tickets, and editing is temporarily disabled. Below it is a progress bar and a countdown, Plan unlocks automatically in 4:12, then Unlocking when the time is up, and a Refresh button. Plan cards and portfolio rows read Being written by the writer's name. In their header, Save and Apply are closed with a lock; their changes stay staged and the buttons open again by themselves.
Your own other windows
Your other windows show no overlay. Their header reads Being written by you in another window, or through the API for a REST Apply, and Save and Apply are closed there until it finishes.
LimitThe lock is the app's own. It does not lock anything in Jira: someone editing the same issue in Jira, or an automation rule, is not stopped by it. That case is caught by the checks in Conflict detection.
59Conflict detection: when the schedule changed while you were editing
A check before the write compares your draft with the shared plan, and a check before each issue compares it with Jira.
Both checks look only at the scheduling fields: start, due, Duration and Buffer. Changes to summary, status or assignee never block an Apply.
The two checks
Shared schedule check
Check before each issue is written
When
After you confirm the review, before anything is written
Just before each issue's write
What it compares
Each row in your draft against the plan's saved value and Jira's value as the plan last read it. A saved value that differs from both, because a colleague saved something else or Jira changed and the plan picked it up, is listed
The issue as Jira holds it now, against the value the plan last read from Jira
On a difference
Opens the Shared schedule differs dialog; nothing is written
The Apply stops before that issue, naming the field, for example SHOP-12 Due date changed in Jira; earlier issues stay written
If it cannot run
Apply stops and asks you to retry when Jira is available
That issue is not written and the Apply stops
The Shared schedule differs dialog
It counts the differing fields and lists each one: issue key, field, the previous value and the current one. Empty values read (empty). To go ahead you tick I understand that applying my draft may replace these shared schedule values.
Your options
Cancel
Writes nothing and keeps everything staged. Escape does the same.
Re-index Plan
Refreshes the plan from Jira, keeping your unsaved and saved edits as described under What Save does, so you can see the other change before deciding.
Apply Anyway
Goes ahead. Your values replace the listed ones for the fields you are writing. The lag guard runs again first.
Knowing you are behind
An open plan also checks every minute whether the plan or Jira has moved since you loaded it, and shows a standing notice when it has. With edits of your own on screen the notice says they are kept and to refresh when you are ready to merge.
60Live updates, presence and your other windows
Who else is on the plan, how their changes reach you, and how your own windows stay in step.
The connection pill in the plan header
Label
Means
Live
Connected to the plan's live channel; other people's changes appear within seconds
Connecting
Connecting to the live channel
Polling
The live channel is unavailable; the app checks every 60 seconds instead
Presence
Beside the pill, avatars show who else has the plan open, up to 5 and then +N. Hover one for the name and the tab they are on; you are marked (you). The cluster is hidden when you are alone. Your window says it is there every 30 seconds and when you switch tabs, someone silent for 90 seconds drops off, and a closed tab leaves at once.
TipA remote change never overwrites your work. When someone applies changes and you have edits of your own, you are told, for example Dana Lee applied changes to this plan, and that your edits are kept until you refresh. A change that came from Jira says This plan changed in Jira instead. With nothing of your own on screen, the plan refreshes to the latest by itself.
Your other windows
Each window of yours knows about the others. Your edits and staged dependencies show in all of them through your draft. When you apply from one window, the others say so once, as you, for example You applied these 2 changes from another window at 14:16. Nothing is waiting to apply. They mention newer edits kept only when there are some. An Apply over the REST API includes your staged dependencies too.
LimitIn Polling mode the drafts count and the lock overlay still update, up to a minute late.
61Plan protection, and undoing changes
The one case where the app changes a Jira issue without an Apply, Undo and Redo for staged edits, and how to back out an Apply.
Plan protection
Plan protection stops a date edit made directly in Jira from breaking a plan's dependencies. When someone moves an issue's start in Jira earlier than its dependencies, or a start-no-earlier-than hold, allow, the app puts the previous start back and posts a comment on the issue headed LeanZero Management: Date change reverted. The comment names the blocking issues or the hold, the latest predecessor due date, the earliest allowed start, the requested start, and the plan, and tells the person to change dates in the plan view, where dependents follow.
How it decides
It uses the plan's own working days and lags, the same rule the schedule uses.
It never reverts a move to a later date, a due-date-only change, or a parent such as an Epic, whose dates come from its children.
It only puts back a previous date that itself keeps the rule. Otherwise it leaves the edit in place and the comment says Date change breaks the plan (left in place).
The revert is written without notifications, but the comment is an ordinary Jira comment, so watchers are notified of it.
LimitProtection is on for every new plan. The app has no switch for it; it can be turned off with protectionEnabled when a plan is created or updated through the REST API. Edits in Jira that break nothing are simply read into the plan within seconds.
Undo and Redo before Apply
The Timeline and the Table have Undo and Redo, up to 50 steps. Cmd+Z (Ctrl+Z on Windows) takes back your last change and Shift+Cmd+Z (Ctrl+Y or Shift+Ctrl+Z) puts it back. Hover the buttons in the plan header to see the step, for example Undo: move SHOP-12 (moved 14 items). One drag is one step however many tickets it moved. Save does not clear the history: an undo after a Save is an ordinary unsaved edit. Applying, Discard All or reloading the plan starts the history over.
NoteUndo does not take back a lag on an existing dependency, because that lag is saved to the plan and shared the moment you set it. The Undo button says so; change the lag back in its own menu.
After an Apply
There is no undo for an Apply. Once it completes, the written values are Jira's values and the plan's new reference point.
What to do instead
Before applying: untick rows in the review, or use Discard All, which reverts your changes in the plan and clears your staged dependencies and rank moves.
After applying: find the previous values in each issue's history in Jira, where the app's change shows the value it replaced. Refresh the plan from Jira, set the old values again and apply.
For dependencies and rank moves: draw the link again, remove it, or drag the row back, then apply.
A baseline is for comparison only. It has no restore action and never writes to Jira.
CarefulBecause Apply writes without notifications, an unwanted Apply is quiet in Jira: nobody gets an email. People who have the plan open at the time are told in the app, and the audit log records who applied.
62The Plan brief
A side panel that says where the plan stands, what needs deciding and what to do next. Everything is computed by the app except two marked AI sections.
Press Plan brief in the plan header. The brief opens as a panel beside the plan and stays open while you work. It replaced Explain in 4.12.0. Everything above its two AI sections is computed from your plan the moment the panel opens, and nothing there changes when AI is switched off. The footer says so: "Every number above is computed from your plan; the AI writes only the marked sections."
What the brief shows, top to bottom
Section
What it says
Where it comes from
Headline (the one thing to know)
The plan's status word, the same one the plan header shows, with its room against each target. Under it, How much of the open work is dated, as a bar and a share.
Computed
Decisions needed
The questions a sponsor has to answer, for example what a target includes. Buttons: Scope <target>…, Show the N work items, Open comment, and Not a decision to dismiss one.
Computed. A decision picked up from a comment carries an AI read chip.
Do this next
Up to three moves, the same list in the same order as Do this next at the top of the plan. Buttons: Open in Jira, Show on timeline (Show the loop for a dependency loop), and Set the date or Scope it.
Computed, never AI
What changed
What moved since the baseline and since your last visit, with See what moved.
Computed
What the work items say
Quotes the comment reader kept, blocked first, each with its ticket and Open comment. A button reads the comments: Read the comments · 1 AI call, or Read again · 1 AI call after a first read.
AI (see Read the comments)
For your update
A short status draft from the AI, with a count such as 4 of 4 claims traced to the plan.
AI, traced to computed facts
The numbers
The plan's figures, marked computed · no AI. Explain the numbers opens the full set of computed facts.
Computed
Source labels
Most sentences carry a small source label. Hover it to see the fact behind the sentence and when the brief computed it.
How the next moves are chosen
The next moves cover, in this order: every ticket Jira marks Blocked on the chain that sets the finish (otherwise the riskiest blocked one), a dependency loop the schedule ignores on that chain, and a finish chain nobody is assigned to. When a decision already asks what a target includes, the move points at that decision instead of asking twice. When a comment names a ticket in words that do not match that ticket's summary, the brief asks which ticket was meant.
The AI-drafted update
For your update is the one place the brief asks the AI to write. The app sends the brief's own computed sentences (at most 40): dates, counts, room, target names and dates, issue keys and the ticket and epic names those sentences use. It never sends the issue list, a description, a comment or a person's name. The draft opens with the plan's verdict as the headline states it. Every sentence the app keeps is traced to a fact; hover a sentence's footnote number to see the facts it rests on. A sentence that cannot be traced is dropped, and if none can be traced the section says no sentence could be traced and shows none. Edit lets you rewrite the draft, Copy copies it, and Back to the traced draft returns to the AI's version.
Copy as Monday update
Copy as Monday update in the footer puts a plain-text update on the clipboard: the headline (or your edited update in its place), the decisions, the next moves and what changed, ending with a link to the app. It has no markdown, names each ticket the first time it appears, and is kept to 150 words.
Prepare sponsor report
Prepare sponsor report in the footer opens the Reports tab with a sponsor report draft built on the brief's numbers. See Sponsor reports.
NoteIf the AI is off, has reached its limit or does not answer, the two AI sections say so in place, and the rest of the brief is unaffected.
63Read the comments
One AI call that reads the newest comments on a few chosen open work items and notes what is blocked, slow, waiting for a decision or delivered.
Read the comments is on the Storyline tab of every plan, for people who can edit the plan, and in the Plan brief under What the work items say. It does not need a built storyline. The confirm dialog says what will be read and that nothing is written to Jira; press Read them to start.
What it reads
Up to 12 open work items that have comments, never more, whatever the plan's size.
First the ones that are blocked in Jira, hold the finish, are past their date, or have comments that mention a decision, a blocker or a delay. Remaining places go to the most recently discussed.
Up to five comments are fetched per work item, and only the newest three are sent, each cut to 300 characters.
One AI call. If no comment changed since the last read, nothing is sent and nothing is charged; the result says the notes are from that read.
If another read of the same plan is already running, the new one is refused as busy and nothing is charged. Try again in a minute.
What is never sent to the AI
Restricted comments (limited to a role or group) and service desk internal comments. They are dropped before anything else happens.
Comments written by apps, including this app's own warnings.
Who wrote a comment.
What is stored
The app does not keep the comment text or the author's name. It keeps short phrases the AI pulled out, the ids of the comments they came from, and when they were read, so each note links back to its comment in Jira. A note older than 90 days is dropped. When a comment is deleted or becomes restricted, its note is removed and the plan says the comment is no longer visible here.
What a note can say
Signal
When it is shown
Delivered
Only when the ticket's status in Jira is done. Otherwise the same comment shows as In progress.
Blocked by
Only when the comment says this ticket is blocked by, or waiting on, something.
Going slowly
Only when the comment mentions a delay or the pace of the work.
Decision needed
When the comment asks for a decision.
In progress
Work a comment says is under way. It is never counted as delivered.
Where notes appear
Notes show as a marker on the Timeline bar, the Table row and the Jira issue panel, each linking to its comment. They also feed What's late or blocked?, the Plan brief's next moves and What the work items say, and the sponsor report's Delivered and Risks. Under the button, a line says what the read covered, for example how many work items it read and why each was picked, how many had nothing to report, and how many finish-driving items have no comment at all.
Blocked verification and re-read
A Blocked note read by a version before 4.13.1 cannot always be confirmed from the saved words. Such a note does not count in What's late or blocked?, the Plans page's blocked line or Needs attention, and What's late or blocked? lists it as unverified, with a prompt to re-read to confirm. The re-read reads each cited comment again from Jira, without AI. The item counts as blocked again only when the saved words are the comment's own and say it is blocked. The claim is removed only when the comment rules it out; anything else stays unverified, and a comment that could not be read just then shows as not checked yet. For someone who can edit the plan, this check runs once by itself when the plan opens, and a check that changes a claim is recorded in the audit log. It does not run while AI or Read the comments is switched off.
LimitIf the app has not been granted permission to read Jira comments, the read says so and reads nothing. If the search for decision and blocker comments does not answer, the read still runs, picks its work items by their place in the schedule only, and says so.
64The Storyline
Groups the plan's linked work into named chains and readable steps. AI names the chains; the app decides what belongs where.
The Storyline tab turns the plan's runs of linked work into chains and steps you can read. On a plan with no storyline yet, an editor presses Build the storyline. Once one exists, Build it again sits beside a Cut by picker for choosing a different way to cut the plan. A build changes no date and writes nothing to Jira. It uses the same switch as the AI structure grouping on the Timeline and Table, and counts once against the site's AI limits. People who cannot edit the plan see a read-only view.
How chains are named
The app decides which work items belong to each chain and step. The AI only writes names. It names a chain after the subject its work shares, or after the work it leads to, such as Path to onboarding automation. When no name fits, a chain or step is called after the ticket it leads to, for example Path to Upgrade photo upload pipeline, and this is never presented as the AI's name. Group names never show a range of ticket keys. When the leftover group holds more than 30% of the plan, it reads Not grouped, with how many tasks that is.
Statuses beside the storyline
Status
What it means
What to do
built <date>
When the current storyline was built.
Nothing.
Rules updated
The way chains are named has changed since this storyline was built. The plan itself did not change.
Press Rebuild to name them under the current rules.
STALE
Dates or the schedule moved since the build. Hover for what moved.
Press Rebuild.
AI naming did not finish
The build ran out of time before the AI named everything. Unnamed parts keep plain names.
Press Rebuild.
The last build did not finish
The build stopped before it named every workstream.
Press Rebuild.
Needs a rebuild
The stored storyline is incomplete and cannot be reused.
Press Rebuild.
Too large to rebuild
The plan has grown past what one AI build can group. This is the last storyline that fit, and nothing in it was lost.
No Rebuild is offered.
Large plans
If a plan is too large to build in the time one request allows, the app says This plan is too large to build its storyline in one go, and nothing is built or charged. If only the AI naming runs out of time, a first build still shows the storyline with plain names, and a rebuild keeps the names you had wherever a section still holds the same work items.
NoteAn editor can switch on automatic rebuild in the storyline's status line: when the plan is re-indexed, the structure is rebuilt in the background so it is never stale. It uses an AI action on every re-index.
65Sponsor reports
An editable draft on the plan's numbers, frozen by a capture, then sent as a sealed, numbered version.
From brief to sent report
1Press Prepare sponsor report at the foot of the Plan brief. If the plan already has an unsent draft, it reopens that draft instead of starting another. The Sponsor report button in the plan header opens the Sponsor reports list on the Reports tab, where you can continue a draft.
2The draft opens at once on the Plan brief's numbers, while the report is captured behind it. The top of the draft says where its numbers come from, for example Numbers from the brief, and later Numbers from the capture, verified, with the time.
3When the capture finishes, the draft switches to the captured numbers and lists the lines that changed (See them).
4Write your headline, notes and decision requests. You can do this before the capture finishes.
5Choose the audience: Internal or External sponsor.
6Read Before you send, then send by Confluence, download or copy as text. Each send seals a numbered version.
The capture
A report opened from the Plan brief is named Steering report with its day and time. The capture freezes the plan as it was saved. If someone saved the plan after you opened it and you have unsaved edits, the capture does not start and asks you to reload the plan. One capture runs per plan at a time; a draft whose capture is held, stopped or never began says so at the top, with the way out beside it (Finish it first, Resume the capture, Capture now or Start the capture). A capture that could not finish keeps your text and offers Capture again; while its temporary data is still being cleared, the draft says how many items are left and offers Finish the cleanup.
What you can edit
Your headline
Write your own headline, or keep Use the plan's words. The plan's own reading is always printed under your headline in every copy that is sent.
Notes
A note for the whole report, and a note under any line (Note). The note drafted from the Plan brief is only a start: it is not in the report until you save it, and Send leaves it behind while it is unsaved.
Leave out
Leave a line out of the report, with a reason (Add a reason). The line shows as LEFT OUT by your name. Lines can be left out once the capture has verified the numbers.
Move
Move a section up or down.
Decision requests
+ Add a decision request: the decision you need, why it is needed, options (one per line), a needed-by date and who decides.
LimitThe verdict, the commitments, the finish and the sources are Locked. They cannot be edited, left out or moved. Everything you write carries a PM tag wherever the report is sent, so a reader can always tell your words from the plan's.
Audience
Internal sends the report as it is. External sponsor by default hides ticket keys, Jira links, commenter names and comments quoted word for word. Each keeps what it signals, for example a comment reads as "a comment says it is blocked", and the report says that it hides them. Summaries stay unless you tick Hide summaries too, which replaces them with "a ticket". You can change what is hidden for each report. The audience is always asked for each report and never carried over from the last one.
Before you send
Before you send, the report lists what to look at: a headline that contradicts the plan's status (both are printed), a number or date in your headline that the report does not state, carried text you have not confirmed, an added decision whose needed-by date has passed or that has no owner or date, on an external report what it hides (including any ticket key or person your own text names), and whether the numbers are frozen yet. These are warnings; you can still send. The only thing that holds Send is a capture that has not yet verified the numbers (Send waits for the capture to freeze the numbers, while editing stays open), and unsaved text, which you save or discard first.
Sealed versions and carry-over
Each send seals a numbered version: the frozen document, your edits and the audience. A sent version never changes. Sending again seals a new version; Confluence keeps its own page history. The next report carries your edits over wherever their lines are unchanged and lists what it could not carry. Carried text is marked Carried from the last report, confirm to send, and is not sent until you Keep, Rewrite or Leave out each one (or Keep all).
The Reports tab
The Reports tab opens on Sponsor reports. Your sponsor reports lists Drafts (with Continue draft) and Sent reports with their versions. An older draft says which newer one replaces it (SUPERSEDED) and can be discarded from the list. A report captured before 4.14.0 is marked OLDER CAPTURE and cannot be sent; Capture again starts a new draft. A draft or report can be removed from the editor with Discard this draft or Delete this report; pages already published to Confluence stay in Confluence. The full audit archive of a capture is still available under Export.
NoteOpening, editing and sending a report needs edit access to the plan. Reports can also be drafted, checked and sent over the REST API; publishing to Confluence is only done from the app.
66Publishing to Confluence and downloading
Three ways to send a sponsor report, each sealing a version.
Ways to send
Button
What happens
Send, publish to Confluence (vN)
Seals version N and publishes it as a Confluence page. Sending again updates the same page.
Send, download HTML (vN)
Seals version N and downloads a standalone HTML file with a print layout. Open it and choose Print, then Save as PDF.
Copy as text
Seals the version and copies the report to the clipboard as plain text. If the clipboard is not available, the text is shown to select.
Publishing to Confluence
1Choose the space. The list shows team spaces and only your own personal space, with a filter box.
2Choose the parent page. The choice is remembered for the plan.
3Send. The page will be visible to everyone who can read that space.
If Confluence does not take the page, nothing is sealed or sent. Fix the reason shown and send again.
A page deleted in Confluence is noticed the next time the report opens, and the report stops linking to it.
Page titles and report names use the UTC day, and times on them are labelled UTC, so every reader sees the same day. Dates read like Sep 30, 2026.
A heading in the report note with nothing under it is not published.
In a downloaded report, ticket keys link to the tickets in Jira, and a line with a Jira link stays on one line.
Nothing is written to Jira by publishing or downloading.
LimitPublishing to Confluence is not offered over the REST API. Use the app.
67Review with AI
An optional check of your staged changes from the Apply review, with the app's own checks first.
Review with AI is a button in the Apply review. It opens with what the changes do to each target, and a This Apply line computed from your staged changes, including the lag of each new dependency. Then come two kinds of findings, kept apart.
Checked by the app
Computed over the whole plan, not by the AI, and marked Computed: dependency loops the schedule ignores, parents whose Jira dates disagree with their children, and any staged change that doubles or halves a task's length by 10 working days or more. These are the same checks the Health check uses.
AI review
The AI looks for problems of order, compression and missing links, such as Starts before its predecessor is due, Possible missing dependency or Duration may be too short. Its findings are checked against your plan's dates and calendar.
How much it reads
The AI reads at most 120 of the plan's issues, your staged changes first. The review says how many it read and how many it did not, for example It read 120 of 1,978 issues. The count of rows the Apply writes covers every row, not only the 120 read, and resized epics are named separately.
MEDIUM and HIGH
Findings the plan's own dates disprove are dropped.
A finding is HIGH only when the app can prove it from your dates: the plan starts a ticket on or before the day its predecessor is due, or the change cuts a ticket to less than half its working days. Those carry Checked against your dates.
Anything the AI raises that the app cannot prove is shown as MEDIUM, not HIGH.
The review never shows a green tick for the plan as a whole.
NoteReview with AI writes nothing. It does not change your plan or your Apply. If it fails or is cut off, it says so and you can apply anyway or run it again.
68The Plans page
One row per plan, sorted so the plans that need a person come first.
The Plans page is a table: Plan, Status, Commitment, Forecast finish, Next target and Needs attention, with Trend · 7 days once plans have a week of history. On a narrower window it drops Next target first, then Trend. On a phone each plan is a short card. Every date shows its year. The line above the list says Refreshed hourly from Jira, with the time it was read.
Counts
The header counts every plan once: late, at risk, on track, can't judge yet, no commitment, not measured, delivered, behind a Jira check, and updating. Click a count to show only those plans. A plan that reads Late (at least) or Overdue counts as late whatever its confidence, and the header says how many of the late plans rest on low confidence. When less than half of a plan's open work has due dates, its status chip is outlined and a line under it reads Low confidence with the share that is dated.
Sorting and views
Needs you first (default sort)
Two groups: plans judged from dated work, then plans with too little dated work to judge. Within each, the plans that need a person come first: a blocked item, a commitment within a week or already past, tickets past due, or (in the first group) a Late or Tight status. Plans Jira closes to you come last.
All, Needs attention (with its count), My plans, and Changed since I looked.
Needs attention
Needs attention shows only the plans that need a person, each with its reason. A Tight plan with an 80% or better chance of making its commitment, and nothing else wrong, is not listed. When nothing qualifies it reads Nothing needs you right now.
The shared-problem bar
When at least half of the plans share one problem, such as most of their work having no dates, a bar at the top says it once, with How to fix this. You can dismiss it until it changes.
Search and menus
Use Find a plan or project key to search. It also matches a plan by the Jira project it is built from. Cmd+K (Ctrl+K on Windows) jumps to the search and Escape clears it. Each row's ⋯ menu holds Move to portfolio, Plan info and Delete plan. More holds Import a Jira plan, New portfolio and Propose portfolios. New plan creates a plan.
NoteA plan you cannot see in full in Jira shows as closed, behind a Jira check, with what to ask a Jira admin for. Right after an app update, each plan reads Updating… until it has been measured again, usually within seconds.
69Portfolios
Groups of plans with one status line, a page per portfolio, and an AI proposal for grouping.
The Portfolios tab lists every portfolio, worst first, with its status, commitment, when it lands and what needs a person. Create one with New portfolio: give it a name, choose its Kind (Portfolio or Program) and, optionally, say what it is for. File a plan into it from the plan's ⋯ menu on the Plans page (Move to portfolio).
The portfolio page
A portfolio's page opens on Status, Commitment, Lands and Needs attention. Under What lands, and when, a bar per plan shows when it lands, with each plan's own commitment marked, in red when the plan lands after it. The plans are listed below. Plans other people own can be in a portfolio without being visible to you. Deleting a portfolio does not delete its plans; they keep working and simply stop being part of it.
Copy status summary
Copy status summary puts a plain-text summary on the clipboard for an email or a chat: the portfolio's name and kind, its status, confidence, commitment, when it lands, and what needs attention. It is built from what the page shows, with no AI and no formatting.
Propose portfolios
Propose portfolios (under More on the Plans page, marked AI) suggests groups for plans that are not in a portfolio yet and that you can edit. It reads what each plan is about: the names and descriptions of its Jira projects and a sample of its top-level epics. The AI groups plans that serve the same product, platform or business function. Each proposal shows the Facts the app measured (what the plans share, the finish range and the number of plans) beside the AI's reason.
The app checks every group before you see it: only plans you can edit, no plan in two groups, no group of more than four plans that holds over 60% of them, and no plan whose issues are nearly all in another plan of the same group.
A reason or name that claims something the plans contradict is left out or replaced.
It says how many plans are already in a portfolio and were not proposed again. When a plan it left out shares a Jira project with one of them, it names that plan, its portfolio and how many of its issues it already holds.
When AI is off or the limit is reached, it still groups plans that share a Jira project or a distinctive word in their names, and says no AI was used.
Nothing is filed until you press Confirm. You can leave any group out first; the footer says how many portfolios will be created and how many plans filed.
NotePortfolio and plan figures follow the same forecast as each plan's own page. After a Save, Discard All or Apply, the plan is measured again in the background so the portfolio catches up.
70AI controls
AI is on by default, advisory, capped, and runs on Atlassian-hosted models.
AI is on for every site unless an administrator turns it off. It is advisory: it never changes a date, a dependency, a rank or anything in Jira by itself. Every number the app shows is computed by the app. The Health check, the Dashboard and the next moves use no AI.
Where the switches are
Jira administrators manage AI in Settings, Maintenance, on the AI features card. Only Jira administrators can turn AI on or off or change the limits.
Per-feature switches
Switch
Where the control is
What the AI does
Plan brief
Plan brief button in the plan header
Writes the traced draft in For your update.
AI structure and Storyline
Timeline and Table grouping, and the Storyline tab
Names workstreams and storyline chains.
Read the comments
Storyline tab and Plan brief
Notes what comments say is blocked, slow, delivered or waiting for a decision.
Review with AI
Apply review
Looks for problems in your staged changes.
Build with AI
JQL sources, when a plan is created or its sources are edited
Turns a sentence into a JQL query that Jira then checks and counts as you.
Propose portfolios
Plans page
Suggests portfolios.
Master switch and details
A master switch turns every AI feature on or off at once, and each feature has its own switch. Each line shows today's AI actions, and Details says what the feature does, exactly what it sends to the AI, and its runs this month. When a feature is off, its controls say which switch is off.
Limits
AI actions per day
Default 100.
AI actions per month
Default 500.
One AI action
One press of an AI button or one background rebuild, however many model calls it makes. 0 means no limit. Past a limit, AI actions are refused and nothing is spent until the day or month resets.
Over the REST API
Each person can start at most 20 AI actions every 10 minutes and 200 a day.
Where your data goes
Every AI feature runs on Atlassian-hosted models through Forge LLMs, so what a feature sends stays on the Atlassian platform. The app declares no connection to any outside service. Text from Jira that reaches the AI, such as summaries and comments, is marked as data to read, not instructions to follow. Every AI action is recorded in the app's audit log with its feature, tokens, time taken and how it ended.
TipRun a test review on the card makes one real Review with AI call to confirm the AI round trip works. It needs Review with AI switched on.
71Plan roles, visibility and Jira permissions
The five plan roles and what each can do, how the app decides your role, plan visibility, and the Jira permissions that sit on top of every role since 4.12.0.
Two things decide what you can do with a plan. The first is your plan role: every plan has an owner, a member list and a visibility setting. The second, since 4.12.0, is Jira itself: plans follow Jira's project permissions, so a role only counts when Jira also lets you see everything the plan is built from.
What each role can do
Role
Open the plan
Edit, save and Apply
Delete the plan
Manage members and visibility
Admin (a Jira administrator, or a member given the Admin role)
Yes
Yes
Yes
Yes
Owner (the person who created the plan)
Yes
Yes
Yes
Yes
Editor
Yes
Yes
No
No
Viewer
Yes
No
No
No
No access
No, the plan is not listed
No
No
No
What editing and viewing cover
Editing covers everything that changes the plan: dates and durations, Save, Apply to Jira, dependencies and lags, the plan's Schedule and holidays, targets, baselines, Refresh from Jira and re-index, building the AI structure and Storyline, Read the comments, capturing and sending sponsor reports, and publishing to Confluence. Viewing covers the Timeline, the Table, the Dashboard, the Plan brief and reading reports.
How your role is decided, first match wins
1A Jira administrator (Jira's Administer Jira permission, asked of Jira as you) is Admin on every plan.
2If you created the plan, you are its Owner.
3If you are on the plan's member list, you have the role recorded there: Viewer, Editor or Admin.
4Otherwise the plan's visibility decides: no access, Viewer, Editor or Admin.
Plan visibility
Option in the plan's Permissions
Option in the create wizard
Everyone who is not the owner or a member gets
Private — only invited members (the default)
Private
No access. The plan is not listed for them.
Open to all — everyone can view
Everyone can view
Viewer
Open to all — everyone can edit
Everyone can edit
Editor, including Apply to Jira
Open to all — everyone can administer
Everyone can administer
Admin, including delete and managing permissions
CarefulChanging visibility saves at once, with no confirmation, and shows "Visibility updated". "Open to all — everyone can administer" lets every user of the app delete the plan and change who can see it.
Jira's project permissions come first
Since 4.12.0 a role is not enough on its own. You can open a plan only when Jira lets you browse every project the plan is built from and see every issue in it that carries a security level. This applies in the app and over the REST API, and it applies to Jira administrators too. A plan you cannot see in full shows on the Plans page as closed, with what to ask a Jira admin for, and nothing else of it is shown. Its owner, a plan admin or a Jira administrator can still delete it, and its owner or a plan admin can narrow its sources or re-index it.
Whose Jira access a plan's issues follow
A plan holds only the issues that the person who created it, or who last saved its sources, can see in Jira. If that person loses access to some issues, the plan leaves them out at its next refresh or re-index. If Jira no longer recognises that person, the plan keeps its data and stops refreshing until an editor saves its sources to take it over.
Jira's issue permissions on every write
Since 4.12.1, before anything is written to Jira the app also asks Jira whether your own account may make each change: Edit Issues to change dates, Duration or Buffer, plus Schedule Issues when the change sets Jira's Due date; Link Issues on both issues to add a dependency and on at least one to remove it; Edit Issues and Schedule Issues for a rank change; and Browse Projects on every issue touched. Rows you may not change are left out of the Apply review, marked not allowed with the missing permission named.
Managing members
Where
Open the plan, then Plan settings, then Permissions. Jira administrators also have Settings, Plan Permissions, which lists every plan as an expandable row with a visibility badge (Private, Open — View, Open — Edit or Open — Full Access), the owner, the member count and the issue count. A plan the admin cannot open in full is shown as a closed row with nothing to expand.
Adding someone
Type at least two characters into "Search users to add...". The owner and existing members are shown but cannot be picked ("Already has access"). A picked person is always added as Viewer ("<name> added as viewer"); change the role in the dropdown beside their name. The search asks Jira as you, so you need Jira's Browse users and groups global permission; without it the search finds no one and reads No Jira user matches.
Roles you can give
Viewer, Editor or Admin. Owner cannot be given or transferred. Adding the owner is refused with "The plan owner already has full access".
Removing
The red trash button removes a member at once, with no confirmation. They fall back to what the plan's visibility grants.
Who can do this
The owner, a plan Admin or a Jira administrator. Anyone else is refused with "Permission denied". Changes to plan access are recorded in the audit log.
NoteThe badge at the top right of a plan's Permissions view shows the role the app gives you right now: Admin (purple), Owner (green), Editor (blue), Viewer (slate) or No Access (red). If it is lower than you expect, check the member list first and the visibility second.
72Where permissions are enforced
Every action is checked on the server, not only hidden in the screen. What each kind of action requires, and the few reads that are open.
Hiding a button is never the only protection. Every action the app offers is checked again on the server when it runs, so calling it directly gets the same answer as pressing the button. A check that cannot get an answer from Jira refuses rather than allows.
What each kind of action requires
Action
What it requires
Open a plan and read anything in it (Timeline, Table, Dashboard, Plan brief, reports, schedule, baseline)
Viewer or higher on the plan, and Jira lets you browse every project and secured issue the plan holds
Change a plan (dates, Save, schedule and holidays, targets, baseline, re-index, refresh ranks, dependencies, lags, holds, the AI structure and Storyline build, Read the comments, sponsor reports, Confluence publishing)
Editor or higher on the plan, and the same Jira browse check
Apply to Jira, add or remove a dependency, change rank
Editor or higher, and Jira's own Edit Issues, Schedule Issues or Link Issues on each issue changed
Delete a plan
Owner, plan Admin or Jira administrator. No Jira browse check, so an owner who has lost access to a project can still remove the plan
Manage members and visibility
Owner, plan Admin or Jira administrator
Create a plan or import a Jira Plan
Any user of the app for a new plan. Listing, previewing and importing Jira Plans needs Jira's Administer Jira permission, because Jira's Plans API requires it
Create a portfolio
Jira administrator. Changing or deleting one: a Jira administrator, or the portfolio's owner or admin. Filing a plan into one: Editor on that plan
Change any site-wide setting: Field Mapping, Calculation Engine, the AI features switches and limits, the orphan cleanup
Jira administrator
Read the audit log
Jira administrator, over the REST API
The site-wide settings check
Every site-wide change goes through one check: the app asks Jira, as you, whether you hold Administer Jira. Anyone else is refused with "Jira administrator permission is required for this action", nothing is changed, and the refused attempt is recorded in the audit log. Before 4.12.0 the AI switch and the AI limits were the exception: any user could change them. Since 4.12.0 only Jira administrators can.
NoteReading the site-wide configuration is open by design: the field mapping, the engine settings, the AI switches and usage, and the orphan scan only read. Everything that changes them needs a Jira administrator.
NoteOver the REST API the same checks apply after the permission the integration was granted. A call acts as the person who signed in, so their plan role and their Jira permissions still decide.
73The Settings page and the Field Mapping tab
Where the site-wide settings live, the six tabs, and the six Jira fields the app reads and writes.
The site-wide settings are a Jira administration page titled "LeanZero Management Settings", so only Jira administrators reach it. It has six tabs, in this order: Calculation Engine, Field Mapping, Display, Plan Permissions, Maintenance and API Access. The subtitle and a banner at the foot of the page say the same thing: these are global settings shared by every plan, while working days and bank holidays are managed per plan from the plan's Schedule.
The six tabs
Tab
What it holds
Calculation Engine
The dependency link type and the engine's limits
Field Mapping
Which Jira field holds each date and value the app reads and writes
Display
One preference for your own browser
Plan Permissions
Every plan's visibility and members
Maintenance
The orphaned-data scan and cleanup, and the AI features card
API Access
How to set up the REST API on this site, and any old API tokens to revoke
Custom Field IDs: the six mapped fields
Field
Default ID
What the app does with it
Start Date
customfield_10015
Read at each refresh, written on Apply
Due Date
duedate
Jira's own due date. Read at each refresh, written on Apply
Duration
customfield_11581
Working-days duration. Read at each refresh. Apply writes it only when someone typed it, never one the schedule worked out
Buffer
customfield_12399
Buffer status (Yes/No). Read at each refresh, written on Apply
Buffer %
customfield_12421
Shown and stored, but nothing reads or writes it. Changing it has no effect
Rank
customfield_10019
Jira Software's rank. Read at each refresh, it drives row order. Rank changes are written through Jira's rank API, not through this field ID
Buttons on the Field Mapping tab
custom
An amber pill beside any field whose ID differs from the default.
Reset to Defaults
Refills all six boxes with the defaults. Nothing is stored until you press Save Changes.
Save Changes
Enabled once something changed. Saves the mapping and shows "Field configuration saved". A change is recorded in the audit log.
LimitA box left empty falls back to the default ID, so blanking a field does not break the app. A wrong ID that is not empty does: that field simply reads as empty on every issue.
Per-plan date fields
A plan imported from a Jira Plan can carry its own Start and Due fields (for example Target start and Target end) instead of the site's. Only those two date fields can differ per plan; Duration and Buffer always follow this tab.
When a field is missing on a project
When Jira refuses one field of a write, for example Duration on a project whose screens do not have it, Apply drops exactly the refused field and writes the rest, so the dates still land. To see which issues a plan cannot fully write, open the plan's ⋯ menu and choose Configure fields. The dialog, "Can Jira take these changes?", shows the fields the plan writes, a Blocked tab (issues whose dates cannot be written) and a Partial tab (issues where only Duration or Buffer cannot be stored), with Re-check with Jira. Where a project lacks a field, Add missing fields to <project> adds it; only a Jira administrator who can edit the plan may do that.
74The Calculation Engine tab, setting by setting
Every setting on the engine tab, its default and range, and which ones actually change what you see.
Four cards: Issue Link Dependencies, Chain Calculation Limits, Buffer Task Settings, and Plan Indexing & Storage. A value that differs from its default carries an amber "modified" badge. Reset to Defaults refills every box; Save Changes, enabled once something changed, saves and shows "Engine configuration saved". A change is recorded in the audit log.
Every engine setting
Setting
Default
Range
Effect
Issue Link Type Name
Blocks
free text
Which Jira link type counts as a dependency. Used when a plan is refreshed, when a link changes in Jira, and when you draw or remove a dependency
Max Cascade Depth
10
3–50
Used only when a plan is recalculated through the REST API
Max Parent Roll-up Passes
5
1–20
Used only when a plan is recalculated through the REST API
Max Dependency Graph Depth
15
5–50
No effect: nothing reads it
Max Issues in Single Calculation
150
50–5000
No effect: nothing reads it
Buffer Impact Child Prefix
[BUFFER IMPACT]
free text
Used only when a plan is recalculated through the REST API
Issue Summary Truncation
80
40–200
Summaries are cut to this length when a plan is refreshed. The full summary is always in Jira
Issues per Storage Shard
100
50–200
No effect: storage always uses 100 issues per shard
LimitThe schedule you see in the app, and every preview before Apply, is computed in your browser, and that calculation does not read the limits on this tab. Only Issue Link Type Name and Issue Summary Truncation change what an ordinary plan shows.
TipIssue Link Type Name must match your Jira link type exactly, including case. A link of any other type is not a dependency. If your site uses, for example, "Depends on" instead of "Blocks", set it here and re-index every plan.
Buffer tasks, briefly
A buffer task absorbs delay: when a predecessor pushes its start later, the buffer keeps its due date and shrinks its duration, so the work after it is protected. Buffer Impact Child Prefix does not create anything. It marks tracking issues: a child whose summary starts with it is left out of its parent's date roll-up when a plan is recalculated through the REST API.
75The Display tab
The one per-browser preference on the Settings page, and why it is not a site setting.
The Display tab sits on the Settings page but is not a site setting. Its card, "Gantt Display", says so: "Per-browser preferences for how the Gantt timeline is drawn. These settings only affect your view."
Settings
Parent rollup guides
On by default. Draws thin vertical lines on the Timeline from each parent down to the children whose start and due dates set the parent's dates.
NoteThe preference is kept in your browser. It changes at once in your other tabs, but it does not follow you to another browser or computer, and an administrator cannot set it for someone else.
76Working-day calendars and holidays
Calendars are per plan: the presets, custom calendars, bank holidays, the trap in the create wizard, and how the calendar drives dates.
Every plan has its own calendar. Open the plan, then Plan settings, then Schedule. The page is titled "Plan Schedule" and says "Working days and holidays for this plan. Changes only affect this plan." The active calendar's name is shown at the top right, and there are two sub-tabs: Working Days and Bank Holidays (with a count). Changing either needs edit rights on the plan. A change to the working week or the holidays updates the plan's card in the same save, and holiday changes reach everyone who has the plan open. Plan protection, the AI review and recalculation over the REST API all use the plan's own calendar too.
Presets under Select a Calendar
Preset
Working days
Note
Standard (Mon-Fri)
Mon to Fri
What a plan uses until its calendar is set
Israel (Sun-Thu)
Sun to Thu
UAE (Mon-Fri + Sat half)
Mon to Fri
Same days as Standard: the half day is not modelled
6-Day (Mon-Sat)
Mon to Sat
Choosing a calendar
Clicking a preset saves at once and shows Calendar set to "<name>"; the active one carries an Active badge. "+ Create Custom Calendar" opens a form with a Name (for example "e.g., Saudi Arabia (Sun-Thu)") and seven day buttons. Apply Custom Calendar is enabled once there is a name and at least one day. A custom calendar belongs to that plan only, so create it again on each plan that needs it.
Bank Holidays
Adding
Pick a date, optionally type a name ("Holiday name (e.g. Christmas)"), and press Add or Enter. Add is enabled once a date is picked.
Year filter
Four buttons: last year, this year, next year and the year after. The footer always gives the total, and the count for the selected year when it differs.
Removing
The trash button removes a holiday at once, with no confirmation.
CarefulThe Working calendar you pick in the create or import wizard does not set the plan's working days. A new plan starts on Standard (Mon-Fri) with no holidays. After creating a plan, open Plan settings, Schedule and choose its calendar there, or every date is computed Monday to Friday. The wizard's hint to "Add more calendars in Admin Settings" also has nothing to point to: the Settings page has no calendar editor.
How the calendar drives dates
A working day is a day in the plan's working week that is not one of its holidays.
Duration counts working days and includes both ends: a duration of 1 means the work starts and ends on the same day.
A task that waits on another starts on the next working day after the other's due date, later by the link's lag in working days if it has one.
A due date on a weekend or a plan holiday stays where it is, and the work it blocks starts on the next working day.
A holiday inside a task's dates does not shrink its work: the finish moves out instead.
77AI features: switches, limits and usage
AI is on unless an administrator turns it off. The master switch, a switch per feature, the daily and monthly limits, usage per feature, where the data goes, and the guarantee that AI never changes your plan.
AI is on for every site unless an administrator turns it off. Everything about it is on one card: Settings, Maintenance, AI features. The card has a master switch for the whole site, one switch per feature, today's and this month's usage, and the limits. Only Jira administrators can change any of it (since 4.12.0); a change is recorded in the audit log with the new state of the switch and the limits.
The six features, as the card names them
Feature
Where it is
What it does
Plan brief (formerly Explain this plan)
Plan toolbar
A sheet beside the plan, computed by the app. The AI writes one thing: a short draft for your status update, where every sentence it keeps is traced to a fact the app computed
AI structure and Storyline
Gantt and Table grouping, and the Storyline tab
Groups a plan's rows into named workstreams and storylines, when someone builds it and after each re-index of a plan that asked for it
Read the comments
Storyline tab
Reads the newest comments on up to 12 chosen open work items and notes what blocks or slows them and what decision is asked for
Review with AI
Apply dialog
Checks the changes in the Apply dialog for problems the rules cannot see, before anything is written to Jira
Build with AI
JQL sources, when a plan is created or its sources are edited
Turns a sentence into a JQL query, then has Jira check and count it as you
Propose portfolios
Plans page
Suggests portfolios for plans that are not in one yet
What the card shows
Master switch
"AI features are on for this site" or "off". Turning it off stops every feature at once and shows "AI features turned off for the site".
A feature's switch
Turns one feature off while the rest stay on, and shows "<feature> turned off". A feature whose own switch is on while the master switch is off reads "Off for the site".
Today and This month
Totals for the site: AI actions and tokens, and how many actions are left today and this month (shown in red at zero).
Each feature's row
Its switch, name, where it is, today's AI actions, its state (On, Off or Off for the site) and Details.
Details
What the feature does, exactly what it sends to the AI, and its actions and tokens today and this month.
Limits
AI actions per day
Default 100.
AI actions per month
Default 500.
Save limits
Saves both and shows "AI limits saved". Values are whole numbers of 0 or more.
How the limits count
One AI action is one press of an AI button or one background rebuild, however many model calls it makes. The limits are shared by all six features. 0 means no limit, not off: to stop a feature, use its switch. Past a limit, AI actions are refused and nothing is spent until the day or month resets. A call that failed before the AI answered is not counted. Over the REST API each person can also start at most 20 AI actions every 10 minutes and 200 a day.
NoteWhen a feature is off, the place that uses it says so by name, for example "Plan brief is turned off in the AI features settings. A Jira administrator can turn it back on in Settings → Maintenance → AI features." When the whole site is off it says "AI features are turned off for this site." Nothing is spent.
Where your data goes
Every AI feature runs on Atlassian-hosted models through Forge LLMs, so what a feature sends stays on the Atlassian platform, and the app declares no connection to any outside service. The card states this under "Where your data goes", and each feature's Details lists what it sends. For example, Read the comments never sends restricted or service-desk internal comments, or who wrote a comment, and the AI structure never sends an issue key or a full summary.
TipAI is advisory. It never changes a date, a dependency or anything in Jira by itself. Text from Jira that reaches the AI, such as summaries and comments, is marked as data to read, not instructions to follow, and the app drops AI statements that contradict the plan's own numbers.
Run a test review
Run a test review sends one real review of a two-issue sample plan to confirm the AI round trip works. It is enabled only while the master switch and Review with AI are both on. It answers "Working — the model answered", adding "(a saved answer, no new spend)" when it repeats an answer from the last 10 minutes, or names what failed: a feature turned off, a limit reached, or a call that did not complete. A real run counts as one AI action.
NoteEvery AI action is recorded in the app's audit log with its feature, tokens, time taken and how it ended.
78Maintenance: orphaned plan data
What orphaned plan data is, how the scan confirms it before anything is deleted, and the one destructive action on the Maintenance tab.
The KVS Maintenance card on Settings, Maintenance finds and removes orphaned plan data: stored data that belongs to a plan ID no longer in the app's list of plans. It can be left behind when creating a plan fails partway or a delete is interrupted. Nobody can reach it through the app, but it still uses the app's storage.
Scan and clean up
1Press "Scan for orphans". The scan only reads.
2Each candidate is checked again on its own before it is reported, so a plan created a moment ago is never mistaken for an orphan.
3A clean result reads "KVS is clean" and "No plan IDs in storage are unaccounted for." Otherwise the orphaned plan IDs are listed, each marked "not in plans:list".
4To remove them, press the red Delete button that appears (for example "Delete 3 orphans") and confirm the "Clean up KVS" dialog: "Delete every KVS key for 3 orphaned plans? This cannot be undone."
5The result reads "Cleaned N plans (M keys)", amber with an error count if some keys could not be removed. The list is cleared; scan again to confirm.
CarefulThe cleanup deletes data permanently. There is no undo and no recycle bin. It needs a Jira administrator, and each cleanup that removed something is recorded in the audit log.
TipThe cleanup refuses to run when the app's list of plans is empty but plan data is still in storage. That reading means the list itself was lost, not that every plan is an orphan, and deleting on it would remove every plan on the site. The refusal tells you to recover the plans instead.
Normal deletes
Deleting a plan removes everything stored for it, including its reports, so a normal delete no longer leaves orphans. The scan is there for data left by interrupted operations and by older versions. The Purge Storage button that older versions showed on a plan list that failed to load is gone.
79API Access and the REST API (Preview)
The REST API on production runs through Atlassian's app REST APIs, a Forge Preview feature, with three permissions. API tokens no longer work on production.
Since 4.12.0 the REST API is available on production through Atlassian's app REST APIs. A call is made by an OAuth 2.0 integration and acts as the person who signed in, so their plan permissions and Jira's project permissions still apply. Atlassian still lists app REST APIs as a preview feature. Settings, API Access shows this site's Base URL and Consent parameter, each with Copy, an example call, and the setup steps.
Set it up
1An admin switches it on, once per site: in Atlassian Administration, Apps, Sites, your site, Connected apps, LeanZero Management, View app details, App REST APIs. It is off by default, and the API answers only after this is on. Switching it off later blocks every call.
2A site member creates an OAuth 2.0 integration in the Atlassian developer console (Atlassian's guide: Access REST APIs exposed by a Forge app) and grants it one or more of the three permissions below, the fewest the script needs. Also add Jira's granular scope read:forge-app:jira; without it every call answers 401.
3The person the script acts for consents once, with the consent parameter in the authorize URL. Start with GET viewer/whoami, which names the person a call acts as.
The three permissions
Permission
Path
What it allows
Read LeanZero Management plans
/viewer/…
Read the plans the person may view: plans, issues and schedules, exports, snapshots, baselines, sponsor reports, the health check and confidence
Change LeanZero Management plans
/editor/…
Create and change plans the person may edit: indexing, dates, dependencies, drafts, schedules, snapshots, reports, and applying dates to Jira
Administer LeanZero Management plans
/admin/…
Owner and administrator actions: delete plans, snapshots and reports, manage plan members and default access, read the audit log
LimitA permission is a ceiling, not a grant. Managing plan members or a plan's default access needs Administer LeanZero Management plans and the person must own or administer the plan. Listing or importing Jira Plans needs Administer Jira. Publishing to Confluence and the board, filter and JQL lookups are not offered over the REST API; use the app for those.
CarefulAPI tokens created under Settings, API Access do not work on a production site, so production no longer creates them. Tokens made by an earlier version are still listed there with Revoke, so you can clear them; they let nothing in.
80The audit log
What the app records for 60 days, who can read it, and how: over the REST API only.
Since 4.12.0 the app keeps an audit log for 60 days: who applied changes to Jira, and changes to plans, schedules, reports, plan access, settings and AI features, including REST API calls it refused and site-wide changes refused to someone who is not a Jira administrator. Every AI action is recorded with its feature, tokens, time taken and how it ended.
LimitWrites to Jira and changes to access and AI settings are always recorded. Other routine entries stop for the rest of the day past 500 per person or 3,000 per site.
Reading it
A Jira administrator reads the log, or downloads it as a spreadsheet, through the REST API with the Administer LeanZero Management plans permission. The app has no screen for it yet. The log is read-only, newest first, and can be filtered by date (the last 7 days unless you say otherwise, never past 60), by kind of event, by where it came from (the app, the REST API or the app itself), by outcome (ok, refused, failed), by plan and by text. An issue key in a row is shown only if the reader may browse that issue in Jira now; otherwise the row says "an issue you can't see". Starting a download is itself recorded.
Example calls
GET <base>/admin/audit?group=jira&from=2026-09-20
GET <base>/admin/audit?action=export&scope=all&format=csv
81What's new and the version in the header
The header shows the version your site runs, the number Manage apps shows, next to What's new.
The header shows the version your site is running, the same number Atlassian's Manage apps shows, next to a What's new button. The two numbering schemes differ: release 4.12.0 and later run as Forge version 5.x, so release 4.15.4 shows as 5.13.0. What's new opens a dialog that names the version Running now, then the current release with its date, its headline, a "Do this:" line saying what an admin needs to do, what changed and what was fixed, then every earlier release, newest first. If the site runs a version no release note covers, the dialog says so.
NoteA major update (for example 4.12.0, which runs as 5.0.0) waits until an admin approves it in Manage apps. The "Do this:" line of each release says when that is needed; most releases say "Nothing to do".
82What the app stores, and where
Everything the app keeps lives in its own Forge storage on Atlassian's platform, plus a backup of the setup kept in Jira on your site. It keeps a lean copy of each plan's work items, the plan's own settings, people's unapplied edits, reports and an audit log. It never keeps descriptions, attachments or comment text.
LeanZero Management has no database or server of its own. Everything it keeps is written to the app's Forge storage, which Atlassian hosts for this installation. Jira stays the record for your work items: the app reads from Jira, keeps a working copy for planning, and writes back to Jira only when someone applies a plan. One thing lives outside it: the setup backup. Since 4.16.0 the app keeps a compressed copy of its whole setup (plans with their rows and unapplied edits, members, reports, notes, settings, capacity) in Jira on your site, as user properties of the app's own account, so that a reinstall can bring the setup back. Only Jira administrators can read it, it never leaves Atlassian, and it stays after an uninstall until a Jira administrator deletes it in Settings, Maintenance, Backup and restore, Delete backup. Once per Atlassian's reporting cycle (7 days unless Atlassian sets another period) the app reports the Atlassian account IDs it stores to Atlassian's Personal Data Reporting API. For an account Atlassian reports as closed, it deletes that person's capacity settings, last-viewed marks, AI answer caches and their own drafts of unsaved edits, removes them from plan members, and writes Former user in place of their name as plan owner and last writer; names in plan rows follow Jira at the next re-index. Snapshots, scenarios and captured sponsor reports are sealed records and keep the names they were captured with; notes written on a sponsor report keep the writer's name; and capacity rosters, portfolios, other people's capacity settings and an AI structure not rebuilt since keep the name too. The account ID itself stays where the app records who did something, such as plan ownership and the audit log (60 days). Each report carries at most 90 account IDs each with the date the app first noted it or last refreshed the person's name, and each account is reported about once per reporting cycle: 7 days, or the period Atlassian sets, kept between 1 and 30 days. For an account Atlassian reports as changed, the app reads the person's name from Jira again and updates it where they are plan owner, member or last writer. This uses the report:personal-data permission, added in 4.18.0.
What the app keeps
What
What it holds
Kept until
Each plan's work items
A lean copy of every work item in the plan (see the next table), split into small pieces so a large plan fits the platform's storage limits
The next refresh or re-index replaces it; deleted with the plan
Plan settings
Name, sources, owner, members and default access, calendar and holidays, targets, scenarios, start-no-earlier-than holds, dependency lags, the Capacity roster
Deleted with the plan
Unapplied edits
Edits people have saved but not applied, and each person's draft of unsaved edits and staged dependencies
Applied or discarded. A personal draft nobody has touched for 24 hours is cleared at the plan's next hourly refresh
Baselines, snapshots and reports
Frozen copies of the plan's dates and numbers, sponsor report drafts, the PM's notes on them and every sent version
Deleted by their owner, or with the plan
AI results
The AI structure and Storyline, notes extracted by Read the comments (with the ids of the comments they came from, never the author), and short-lived cached answers
Rebuilt or replaced; deleted with the plan
Per-person view state
What each person last saw of a plan, for since you last looked, and who has a plan open right now
Presence clears 90 seconds after a person leaves; the rest is kept per person
Site settings
Field mapping, engine and calendar settings, the AI switches and limits, and the AI usage counters
Until an administrator changes them
Portfolios
Each portfolio's name and description; membership is recorded on each plan
Until the portfolio is deleted
Audit log
Who did what in the app and what the app did by itself (see Audit log below)
60 days
What one work item row contains
Field
What is kept
Key, id, summary, type, status
The summary is cut to 80 characters by default (Issue Summary Truncation under Settings, Calculation Engine)
Parent and children
Only parents and children that are in the plan; a parent outside the plan is remembered as a marker
Assignee and reporter
Display names, plus the assignee's account id for the Capacity tab
Priority, labels, resolution, fix versions, story points
As Jira holds them
Created, updated, resolved, status category changed
The day only, in UTC
Start date, due date, Duration, Buffer, rank, remaining estimate
The scheduling fields from your field mapping, plus Jira's own values as they stood at the last read, which Apply compares against
Dependencies
Links of the configured type (Blocks by default) to other work items in the plan; links to items outside the plan are not kept
Project and security level
Used to check that each viewer may see everything the plan holds
Assets references
Only when the plan uses Assets fields; names are read fresh, as the viewer, each time
NoteNever fetched or stored: work item descriptions, attachments, worklogs and custom fields other than the ones you map. Read the comments reads the newest comments of a few chosen tickets when someone presses it, but does not keep the comment text or who wrote it. Restricted and service desk internal comments are never read for it.
Personal data the app keeps
Display names and account ids of plan owners, members and the people who staged edits or hold a running Apply.
Assignee and reporter display names on work item rows, and the assignee's account id.
The Capacity roster: each person's account id, name, weekly hours and days off.
Presence: the name and 24 by 24 avatar link of whoever has a plan open, for 90 seconds.
The audit log: who acted. Email addresses and anything shaped like a token or key are replaced by [redacted] before a row is written.
83How a large plan is stored
A plan's work items are stored in pieces of at most 100, so a plan of thousands of items fits the platform's per-value limit and one item can be read without loading the whole plan.
Forge storage limits each stored value to 240 KiB. The app therefore splits a plan's work items into pieces of at most 100 items, and fewer when the rows are large, plus one index that says which piece holds which item. A 5,000-item plan is about 50 pieces. The split is decided in full before anything is written, so a re-index never leaves a half-written plan.
There is no fixed cap on how many work items a plan can hold. The real ceiling is that the plan's index, one value naming every item, must fit within the platform's per-value limit. If a plan outgrows it, the app refuses the re-index before writing anything and keeps the data the plan already had.
NoteDependency lags are not stored on the work item rows. Jira has no place for a lag, so the app keeps each lag against its Jira link in a separate record that a refresh from Jira never overwrites. A link removed and drawn again in Jira starts with no lag (4.15.0).
84Where the app runs: Atlassian only, no outside connections
The app declares no connection to any outside service. It talks only to your Jira site, your Confluence site when you publish, its own Forge storage and Atlassian-hosted AI models through Forge LLM.
A Forge app can only reach the outside hosts it declares in its manifest. LeanZero Management declares none, so the platform does not let it send data anywhere outside Atlassian. There is no analytics service, no telemetry, no license server and no LeanZero backend. The app is built only on Atlassian's own Forge libraries.
The four places data moves
Path
What moves
Where it goes
Jira REST
The work item fields listed above, links, comments for Read the comments, project, board and filter details, permission checks, and the writes Apply makes
Your Jira site only
Confluence REST
A sponsor report you publish, and the space and page list you pick from
Your Confluence site only, as you, with your Confluence permissions
Forge storage
Everything in What the app stores
Atlassian-hosted storage for this installation
Jira user properties
The setup backup: a compressed copy of everything in What the app stores except API tokens, the audit log and runtime state
Your Jira site, on the app's own account, readable by Jira administrators only; it stays after an uninstall until an administrator deletes it
Forge LLM
What each AI feature sends, when someone uses it (below)
Atlassian-hosted models; the manifest declares the Claude model family
What the AI features send
AI is on for every site unless a Jira administrator turns it off under Settings, Maintenance, in the AI features card. There is one switch for the whole site and one per feature: Plan brief, AI structure and Storyline, Read the comments, Review with AI, Build with AI and Propose portfolios. Each feature's Details on that card says exactly what it sends to the model. The models are Atlassian-hosted through Forge LLM, so what a feature sends stays on the Atlassian platform. The AI is advisory: it never writes a date, a dependency or a rank.
Plan brief: the brief's own computed sentences, at most 40. Never the issue list, a description, a comment or a person's name.
AI structure and Storyline: counts and dates per group, words that repeat in summaries, and a few summaries cut to 40 characters. Never an issue key, a full summary or a label.
Read the comments: for up to 12 chosen tickets, the key, the status and the three newest comments cut to 300 characters. Never the comment's author.
Review with AI: the plan's rows as drawn (keys, summaries, types, dates, durations, links), up to 120 of them, and the plan's working calendar.
Build with AI: the sentence you typed, today's date, the site's field names, the projects you can see and their issue types and statuses. Never a person or an email address.
Propose portfolios: for plans you can edit, their names, finish dates and issue counts, the key, name, category and description (cut to 200 characters) of each Jira project they draw from, up to eight top-level epic or parent summaries per plan (cut to 90 characters), and how many projects, name words and issues two plans have in common. Never an issue key, an assignee or an account.
NoteProduction carries no web trigger. The developer test hook and the token-based REST door exist only on LeanZero's development environment and are removed from every production release, which is why the app qualifies for Runs on Atlassian (4.11.0).
85Every permission the app asks for, and why
Seventeen scopes: Jira reading and writing for planning and Apply, two Jira configuration scopes for one-time field setup, two Assets scopes, storage, Atlassian's personal data reporting, and three Confluence scopes for publishing reports.
Declared scopes
Scope
Why the app needs it
read:jira-work
Read the work items a plan is built from, their links and the comments Read the comments looks at; run and check JQL; notice changed work items
read:issue-details:jira
Read the specific fields the plan keeps
read:project:jira
Show projects in the source picker with their name, type and size, and find a project's edit screen during field setup
read:jira-user
Show who holds a running Apply or staged an edit, name plan owners, and search for people to add as plan members or to the Capacity roster (the search runs as you, so Jira's Browse users and groups permission decides what it finds)
write:jira-work
Apply: write start date, due date, Duration and Buffer, and create or remove dependency links. Plan Protection uses it to put back a date change that breaks a dependency and post a comment saying why. The setup backup is written to, and deleted from, Jira user properties of the app's own account with it
write:issue:jira-software
Only to turn a reorder of rows into a real Jira rank change; no other field is written with it
read:board-scope:jira-software
List boards in the source picker and read a board source's work items
read:board-scope.admin:jira-software
Show a board's real scope before you add it: its saved filter's JQL and its columns
manage:jira-configuration
Field setup, only when a Jira administrator asks for it (Settings, Field Mapping, Set up fields, or their first plan): create PPM Duration and PPM Buffer if the site has no such fields, and add a project to a field's context when Add fields asks for it. It also reads field contexts, issue type screen schemes and the instance licence (whether Jira Plans exist). It never edits workflows or permissions and never deletes a field
manage:jira-project
Changes project configuration: field setup adds the Start date, Duration and Buffer fields to edit screens (each project's edit screen and the Default Screen), and reads screens and screen schemes to find them. Only for a Jira administrator's request
read:cmdb-object:jira, read:servicedesk-request
Assets fields (plan ⋯ menu, Assets fields): list Assets workspaces and read the Assets objects on work items. Always as you, never as the app
storage:app
The app's Forge storage
report:personal-data
Once per reporting cycle (7 days unless Atlassian sets another period), report the Atlassian account IDs the app stores to Atlassian's Personal Data Reporting API, and learn which of those accounts were closed (the app then deletes what it keeps only for that person and writes Former user in place of their name as plan owner and last writer) or changed (the app refreshes the stored name). Only account IDs and dates are sent
Publish a sponsor report to Confluence: list spaces, read a page's current version before updating it, create or update the page. Always as you. The app has no scope to delete a page
How Apply writes
Apply writes as the app, with Jira notifications off so a large Apply does not send an email per work item, and with Jira's screen check bypassed so a field missing from one edit screen does not block the whole write. Three things bound that. Only the four mapped scheduling fields can ever be written. Before anything is written, the app asks Jira whether YOUR account may make each change (Edit Issues, plus Schedule Issues for the due date; Link Issues for dependencies; Edit Issues and Schedule Issues for rank), and leaves out any row it may not (4.12.1). After writing, it reads every work item back and reports anything Jira did not store.
NoteThe app also offers three permissions of its own for the app REST API: Read LeanZero Management plans, Change LeanZero Management plans and Administer LeanZero Management plans. These are scopes an OAuth 2.0 integration asks for when calling the app; they give the app no extra access to your site.
TipAdding a product's scopes is a major update. When a release asks for new access, a site administrator approves it in Manage apps before the site gets it, and the release notes say so under Do this.
86How and when a plan stays current with Jira
Field changes and dependency changes made in Jira reach the plan within seconds; an hourly refresh catches anything the events missed; a plan is measured again after each Save and Apply.
What keeps a plan current
When
What happens
A work item in the plan changes in Jira
The app hears it within seconds and updates that one row in every plan that holds it. An open plan says that Jira changed, and your own edits in progress are never overwritten
A dependency link is created or removed in Jira
It reaches the plan within seconds, not at the next refresh (4.12.0)
Every hour
Every plan is checked against Jira. The app first asks Jira how many of the plan's work items changed since the last read; if none did, or the rebuilt data is identical, nothing is rewritten. Plans are worked through in turn, so on a site with up to about 11,000 plans each one is reached within the hour
While a plan is open
The page checks for changes every 60 seconds and shows a notice when Jira has moved on
After a Save or Discard All
The plan is measured again in the background, so the Plans page and portfolios show the new numbers at once instead of after the next hourly refresh (4.14.1)
After an Apply
The plan card and portfolio show the new finish straight away
Plan Protection
Plan Protection, on by default for every plan, watches date changes made in Jira itself. If someone moves a work item's start earlier than its predecessors allow, the app puts the previous dates back and posts a comment on the work item saying why. When the previous dates broke the same rule, it leaves the new dates in place and only comments. It uses the plan's own working days, and every revert or flag is recorded in the audit log.
CarefulA plan holds only the work items that the person who created it, or who last saved its sources, can see in Jira. If that person loses access to some of them, the next refresh leaves them out. If Jira no longer recognises that person, the plan keeps its data and stops refreshing until an editor saves its sources and takes it over (4.12.0).
87What happens on Refresh from Jira now
A manual refresh rebuilds every work item row from Jira in the background. It keeps your plan's own settings and your unapplied edits, and it will not empty a plan because of a passing glitch.
Refresh from Jira now is in the plan's ⋯ menu for anyone who can edit the plan. It queues the work and returns at once; the plan shows Queued, then Indexing, and loads the new data when it is done. The background job has up to 15 minutes, so large plans do not time out.
What a refresh does
1On a plan's first index, if the scheduling fields are not set up yet, the app finds or creates them and adds them to the edit screens of the plan's projects.
2It reads every source (JQL, project or board), removing duplicates.
3It walks down to the children of every item it found, and, when the plan includes parents, up to their parents.
4It keeps only the work items the plan's owner of record can see in Jira.
5It rebuilds the rows, saves them and tells every open copy of the plan to reload.
Kept
Rebuilt
Members and access, calendar and holidays, targets, holds, scenarios, the Capacity roster, baselines and reports, and dependency lags whose Jira link still exists
Every work item row, from Jira
Edits you saved but have not applied. Where Jira changed the same field, Jira wins and the app names the edit it dropped (4.4.0)
The lags of links that no longer exist in Jira are dropped
CarefulIf a refresh suddenly matches no work items while the plan held some, the app keeps the previous data and tells you to check the plan's sources, rather than showing an empty plan. The exception is when the plan's owner of record can no longer see the work items at all: then the plan is emptied, because that is what Jira would show them.
88Limits: the real numbers
The limits the app enforces, with their values from the code.
Plans and storage
Limit
Value
Notes
Work items per plan
No fixed number
The plan's index must fit the platform's 240 KiB per-value limit; a plan that outgrows it is refused before anything is written
Summary length kept
80 characters
Default; an administrator can change it
Background index job
15 minutes
Per refresh or re-index
Hourly refresh reach
Every plan within the hour up to about 11,000 plans
Beyond that a full pass takes more than one hour
Open plan check
Every 60 seconds
Presence
90 seconds after the last heartbeat
Running Apply hold on a plan
5 minutes, renewed while it writes
AI
Limit
Value
Notes
AI actions per day
100 by default
Site-wide; set under Settings, Maintenance, AI features. 0 means no limit
AI actions per month
500 by default
As above. One AI action is one press of an AI button or one background rebuild, however many model calls it makes
Review with AI
Reads up to 120 rows
The app's own checks (dependency loops, parents whose Jira dates disagree with their work, big changes in length) still cover the whole plan, and the review counts every row the Apply writes
Read the comments
Up to 12 tickets, three newest comments each
Comments cut to 300 characters. A second read of the same plan while one runs is refused as busy and not charged
Plan brief
At most 40 sentences sent
AI over the REST API
20 AI actions per 10 minutes and 200 a day, per person
On top of the site's daily and monthly limits
Repeat AI requests
Answered from a 10-minute cache
The same request within 10 minutes spends nothing
Audit log
Limit
Value
Retention
60 days
Routine entries per person per day
500
Routine entries per site per day
3,000 for everything people do together
Entries the app writes by itself per day
1,000
Always recorded, whatever the counts
Writes to Jira and changes to access and AI settings
LimitVery large plans have one more practical limit: if a plan is too large to build its storyline in the time one request is allowed, the app says This plan is too large to build its storyline in one go and nothing is built or spent (4.12.2).
89Audit log
The app records who applied changes to Jira, who changed plans, access, settings and AI features, what the app did by itself, and which requests it refused. Entries are kept 60 days and are read by a Jira administrator over the REST API.
What is recorded
Who applied which changes to Jira, and changes to plans, schedules, reports, plan access, settings and AI feature switches.
Every AI action, with its feature, tokens, time taken and how it ended.
What the app did by itself, such as a Plan Protection revert.
Requests it refused, including REST API calls.
Entries are kept for 60 days. Writes to Jira and changes to access and AI settings are always recorded. Other routine entries are capped per UTC day: past 500 a person's own routine entries stop for the rest of the day, and past 3,000 for the whole site everyone's do. One entry then says the log was throttled, so the gap is visible. Email addresses and anything shaped like a token or key are replaced by [redacted].
A Jira administrator reads the log, or downloads it as a spreadsheet, through the REST API with the Administer LeanZero Management plans permission. The app has no screen for it. Work item keys in an entry are shown only when the reader can browse them in Jira now; others read as an issue you can't see.
NoteThe audit log is append-only. Nothing in the app reads it to decide anything, and no one can edit or delete an entry; entries expire after 60 days.
90Who can see and change what, and how data is deleted
Plans follow Jira's own project and issue permissions, plan roles decide who may edit and manage a plan, and Apply only writes what your own Jira account may change. Deleting a plan removes everything the app kept for it.
Plans follow Jira permissions
Since 4.12.0 you can open a plan only when Jira lets you see every project and every work item it is built from, including work items with a security level. This holds in the app and over the REST API, and for Jira administrators too: administering Jira is not the same as browsing a project. A plan you cannot see in full shows on the Plans page as closed, with what to ask a Jira admin for, and nothing else of it is shown.
Plan roles (Plan settings, Permissions)
Role
How you get it
What you can do
Owner
You created the plan
Everything on the plan, including delete and managing members
Admin
Added with the Admin role, the plan's default access is everyone can administer, or you are a Jira administrator
Everything on the plan
Editor
Added with the Editor role, or the plan's default access is everyone can edit
Edit, save and apply; refresh from Jira
Viewer
Added with the Viewer role, or the plan's default access is everyone can view
View only
No access
Not a member, and the plan is Private
The plan is not listed
Where access is enforced
A new plan is Private: only its owner and invited members see it.
Plan roles are checked on the server, not only hidden in the screen. A role is never enough on its own: Jira's project and issue permissions are checked too.
Apply, dependencies and rank changes also need your own Jira permissions on each work item: Edit Issues for dates, Duration or Buffer, plus Schedule Issues for Jira's Due date; Link Issues for dependencies; Edit Issues and Schedule Issues for rank. Rows you may not change are left out of the Apply review with the missing permission named (4.12.1).
Adding plan members or roster people needs Jira's Browse users and groups permission.
The Settings page (Calculation Engine, Field Mapping, Display, Plan Permissions, Maintenance, API Access) is a Jira admin page. Every change there, including the AI switches and limits, needs Jira administrator rights.
Board, filter, project and Jira Plans lookups are answered as you, so if Jira refuses you, you see the refusal. Listing and importing Jira Plans needs Administer Jira.
REST API access (Preview)
The REST API runs on Atlassian's app REST APIs, which Atlassian lists as a Preview feature. Over the REST API a call acts as the person who signed in to the OAuth 2.0 integration, so their plan roles and Jira permissions apply. It works only after a site administrator switches on the app's REST APIs in Atlassian Administration: Apps, Sites, your site, Connected apps, LeanZero Management, View app details, App REST APIs. API tokens created under Settings, API Access do not work on a production site, and that screen no longer creates them there.
Deleting data
Action
Who
What it removes
Delete plan (plan ⋯ menu, or a row's ⋯ menu on the Plans page)
The owner, a plan admin or a Jira administrator, even when the plan is closed to them
Everything the app kept for the plan: work item rows, settings, unapplied edits, baselines, snapshots, reports and their notes, AI results, comment notes, the Capacity roster and per-person view state
Scan for orphans, then Delete (Settings, Maintenance)
Jira administrators
Leftover data of plans that are no longer registered. The scan shows the list first, and a plan whose own record still exists is never treated as an orphan
CarefulDeleting a plan or a report never touches Jira or Confluence. Dates and links already applied stay in Jira, the PPM Duration and PPM Buffer fields stay, and a report page published to Confluence stays, because the app has no permission to delete a Confluence page.
NoteThe app runs no clean-up of its own when it is uninstalled. What it stored in its Forge storage stays on Atlassian's platform and is handled under Atlassian's Forge rules for uninstalled apps. The setup backup in Jira user properties stays on your site after an uninstall, so a reinstall can restore it. To remove it, a Jira administrator chooses Delete backup in Settings, Maintenance, Backup and restore before uninstalling; to remove plan data too, delete the plans first. From Delete backup until the next Back up now, backups are off and the kept backups cannot be restored or downloaded; a restore from a downloaded file still works.
91Before you troubleshoot: where a change actually lives
Most support questions come down to one thing: is the change only in your draft, saved to the plan, or applied to Jira?
An edit you make on the Timeline or the Table does not go to Jira. It passes through three places, and each has its own button and its own way of being lost. If you can say which place a change is in, you can answer most tickets.
The three places
Place
Who sees it
How it gets there
How it goes away
What the header shows
1. Your draft
Only you, in every window you have open on the plan
Any edit: a drag, a date, a duration, a buffer, a dependency you draw, remove or give a lag, a reorder. It is saved as your draft 1.5 seconds after you stop editing, so it survives a reload.
Save, Apply or Discard All. A draft nobody has touched for 24 hours is cleared by the background cleanup.
Save (N)
2. The saved plan
Everyone: the Plans page, portfolios, reports and your colleagues read the saved plan
Save
Discard All in the Apply review, or Apply
Saved
3. Jira
Everyone in Jira
Apply, and only Apply
Never undone by the app. A write to Jira stays.
Apply N changes
CarefulSave and Apply are two different actions. Save keeps your changes in the plan and never touches Jira. Apply writes to Jira. A plan can hold saved but unapplied dates for weeks; that is how you model a replan before you commit it. Discard All is inside the Apply review.
Writes that do not wait for Apply
Plan protection. When someone changes an issue's start date directly in Jira and the new start breaks a dependency (or a start-no-earlier-than hold), the app puts the start back and posts a comment headed "⚠️ LeanZero Management: Date change reverted". It only reacts to a start-date change; a change to the due date alone is never put back. If the previous start breaks the same rule, the date is left in place and the comment says so. Protection is on for every plan created in the app. There is no switch for it in the app; it can be turned off per plan through the REST API.
Custom fields at the first index. If the site has no field named Duration or PPM Duration, the first index creates a number field called "PPM Duration"; if there is no Buffer or PPM Buffer, it creates a select field called "PPM Buffer". These fields stay on the site.
A lag on an existing dependency is saved to the plan as soon as you set it and is shared with everyone. Undo does not take it back; you change it back in the link's own menu. A lag on a dependency you have drawn but not applied travels with your draft instead.
What never writes
Nothing the AI does writes to Jira, and nothing on the Health check writes to Jira either: a fix that changes dates opens a review, and what you accept goes into your draft for the usual Apply.
92Reading the Timeline: what each bar is telling you
A bar's colour is its state. Outlines, end-caps, stripes and diamonds are extra marks that sit on top of the state, and the legend only lists the marks the plan actually has.
The Gantt tab is now the Timeline. Every bar is coloured by its state, worst first, and the legend is always on screen. Click a bar to open a card with its state, its dates, its room and what it waits on.
Fill: the state
Fill
Meaning
Done
The status category is done.
Blocked
Open, and Jira says it is blocked: its status, or its comments as Read the comments read them. Drawn in the Late colour with a pause mark.
Late
Open and dated, and its finish is before today, or the forecast of open work past due puts it past its finish.
At risk
Open, with 5 working days of room or fewer before it moves the plan's finish.
On track
Open and dated, with more room than that.
No dates
No finish date. Never drawn as a bar and not in the forecast. These items are listed in the No dates section.
Marks on top of the fill
Mark
Meaning
Outline, and Sets the finish in the toolbar
The item has 0 working days of room: it is on the chain that sets the plan's finish. Sets the finish shows just that chain in a lane of its own.
Teal end-cap, with a hollow diamond
Plan moved it from Jira's date. The schedule places it away from the date Jira holds; the hollow diamond is Jira's own date.
Pink striped extension
Forecast, not a Jira date. Open work past its due is placed after today. It is never written to Jira and cannot be dragged.
Amber stripes
Buffer: an item that absorbs slip before it reaches the work after it.
Violet stripes
Exhausted buffer: a buffer that has been used up (one day left).
Grey bar under a bar
Baseline: where it was when the baseline was set.
Black diamond on a parent
Jira due: the parent's own Jira due date, shown when it is earlier than its items finish.
Red !
Done, but dated in the future.
Diamond instead of a bar
A milestone. An item is a milestone only when its start equals its due AND either its Duration is exactly 0 or its issue type is Milestone. Parents and buffers are never milestones.
"↑ KEY" chip on a row
The item's Jira parent is not in this plan, so the row sits at the top level. Click the chip to open the parent.
Views and zoom
The real plan (the first view): the epics that hold work, dated work outside an epic grouped by quarter (by month on a short plan), and undated work outside an epic folded into one row.
Everything: every row.
Needs attention: what needs a decision, grouped by reason, worst first, with a one-line why for each.
Zoom: Fit (the first view, the whole plan), Week, Month, Quarter and Year. Day zoom is in the Timeline's ⋯ menu. Which rows, grouping and zoom you chose are remembered per plan in your browser and never change the plan.
TipA one-day task is a bar, not a diamond. If a real task draws as a diamond, its Duration holds exactly 0. If a milestone draws as a one-day bar, its Duration is empty rather than 0.
93Troubleshooting: dates, dragging and the schedule
When the schedule did not do what someone expected, the cause is nearly always a dependency, a hold, a buffer, the plan's working days or a field the project cannot store.
Symptom
Likely cause
What to do
A dragged task snapped back, with a message ending "Cannot move before." or "Cannot move after."
It has a predecessor. A successor starts on the working day after its latest predecessor finishes, plus that link's lag. It sits on that day: it cannot be dragged earlier, and it cannot be dragged later either.
Move the predecessor and let the chain follow. To start the task later, set a lag on the link. If it should not be bound at all, remove the link.
The message says the task "is held to start no earlier than" a date
A start-no-earlier-than hold. Holds are set through the REST API; the app has no screen for them yet. The Timeline names the hold on hover.
Move the hold, or remove it through the REST API.
"N work items snapped to respect dependency rules"
Several items were pulled back in one pass, and their messages were collapsed into one.
Open Why did this move? to see each item that moved and why. Undo (Cmd+Z, or Ctrl+Z on Windows) takes the change back.
I pushed a predecessor and its successor did not move
The successor is a buffer with room left. A buffer keeps its due date and gets shorter, so the work after it does not move until the buffer is used up.
Check that the bar has amber stripes and got shorter. Violet stripes mean the buffer is used up; the next push goes through to the work after it.
A start landed a day or two from where I dropped it
The plan's working days. Starts are placed on working days of the plan's calendar and its holidays.
Check Plan settings, Schedule. The presets are "Standard (Mon-Fri)", "Israel (Sun-Thu)", "UAE (Mon-Fri + Sat half)" and "6-Day (Mon-Sat)", plus custom calendars. The UAE preset has the same working days as Standard.
A due date on a weekend did not move to Monday
By design. A due date on a weekend or plan holiday stays where it is, and the items it blocks start on the next working day. The date editor and the Apply review say so.
Nothing to do, unless the due date itself is wrong.
Switching the calendar re-dated the whole plan
Choosing a calendar re-runs the schedule under the new working days ("Dates recalculated for new working day schedule"). The moved dates are unsaved edits like any other.
If it was a mistake, use Discard All in the Apply review before you apply.
I cannot draw a dependency
The link was refused before anything was staged: the item cannot depend on itself, the link already exists, it would close a loop, or one item sits inside the other (a parent's dates already roll up from its children).
Press Escape to cancel. To reverse a relationship, remove the old link first.
The plan shows a dependency loop
Two or more items wait on each other. The schedule ignores the link that closes the loop, the legend shows "Loop, ignored", and the Health check lists the loop.
Remove one link of the loop in Jira or in the plan.
An item sits at the top level instead of under its epic
Its parent is not in the plan, so the row shows the "↑ KEY" chip. Plans created in the app include parents by default. The chip's tooltip mentions an "Include parents" setting, but the app has no control for it; it can only be changed through the REST API.
Widen the plan's sources (Plan settings, Sources) so the parent is matched.
A milestone came back as a one-day task after Apply
The project cannot store the Duration field, so the declared 0 never reached Jira.
Make Duration storable on that project (Configure fields in the plan's ⋯ menu shows what the plan cannot update), or use the issue type Milestone, which needs no Duration.
An item's start is after its due
A real data state. The app calls these dates that don't fit, and the Health check lists the open ones under Stops the forecast.
Fix the dates in the plan or in Jira.
One edit moved far more than expected
An item with several predecessors waits for the latest of them, so one change can move a long fan of work.
Open Why did this move?. Undo takes back the whole drag as one step, however many items it moved.
The chain slipped but the plan's finish did not move
Another chain sets the finish. Work with room can slip without moving the finish.
Turn on Sets the finish to see the chain that does, or read the Room column in the Table.
Rows keep reordering themselves
Auto-arrange is on. It orders rows in the Everything view so dependency lines stay short, and it never changes Jira rank.
Turn off Auto-arrange rows (Everything) in the Timeline's ⋯ menu.
LimitUndo and Redo only cover changes that are not in Jira yet, up to 50 steps. Applying to Jira, Discard All or reloading the plan starts the history over; your unsaved draft still comes back after a reload.
94Troubleshooting: applying to Jira
Everything between pressing Apply and the change existing in Jira: the review, your own Jira permissions, conflicts, the lock, and an Apply that stopped partway.
What Apply does
1The Apply review opens. It lists the changes by kind, says what they do to each target, and shows each new dependency's lag. You can untick a row; the dates that change alone would have moved are left out with it. Review with AI is optional.
2The review asks Jira whether your own Jira account may make each change. A row it refuses is unticked, cannot be ticked back on, and carries a red "not allowed:" label naming the missing permission.
3If shared schedule values changed since you started editing, the Shared schedule differs dialog opens: Cancel, Re-index Plan, or tick "I understand that applying my draft may replace these shared schedule values" and press Apply Anyway.
4Only one Apply runs on a plan at a time. If another one is finishing, yours waits and tries again by itself; Cancel stops the waiting. Other people see the "Plan is being written" overlay.
5The app writes your new dependencies first, then the dates, one issue at a time. Your permission is checked again for each issue before it is written. The progress shows "Writing to Jira" with the issue being written and how long it has taken.
6When the last write is checked, the dialog says Applied and where the plan now stands against its commitment.
Symptom
Likely cause
What to do
Rows marked "not allowed: Your Jira account may not edit KEY (Jira's Edit Issues permission), so nothing will be written for it."
The person applying lacks a Jira permission on that issue. Dates, Duration or Buffer need Edit Issues, plus Schedule Issues when the change sets Jira's Due date. Adding a dependency needs Link Issues on both issues, removing one needs it on at least one. Rank changes need Edit Issues and Schedule Issues. Everything also needs Browse Projects.
Give the permission in Jira, or let someone who has it apply. When you apply the rest, your edits on the refused rows go back to what Jira holds.
"Jira could not confirm what your Jira account may change."
Jira did not answer the permission question. Every row stays in, and Apply asks again before writing anything.
Retry shortly.
Some of my dates were held back
They were computed for a dependency a colleague has staged but not applied. Your Apply holds them back and the review names the dependency and who staged it.
Wait for the colleague to apply or discard the dependency, stage the same dependency yourself, or release the hold (anyone who can edit the plan can; the release is confirmed first and recorded in the audit log).
A dependency could not be created
Jira refused the link. The dates that depend on it are not written, and the dependency stays staged.
Fix the cause (link type, permission) and apply again.
"Applied N · M couldn't be written to Jira — still staged, Apply again to retry"
Some link, unlink or rank changes were refused. They stay staged on purpose, so nothing is silently lost.
Fix the cause and apply again.
Dates will not store on one project
The field is not available on that project, for example not on its screen, or the project is team-managed and owns its own fields. Jira can accept a write for such a field and store nothing.
Open Configure fields in the plan's ⋯ menu to see what the plan cannot update, and add the field to that project. The Health check also lists items the plan cannot update in Jira.
"Plan is being written" overlay with someone else's name
Another person holds the plan's write lock. The overlay shows their progress and "Plan unlocks automatically in" a countdown.
Wait. The lock lasts 5 minutes and is renewed while the Apply runs, so an abandoned Apply frees the plan within minutes.
An Apply stopped partway ("Earlier Apply found", "Apply interrupted" or "Resume interrupted Apply")
The window was closed or reloaded, the connection dropped, or a permission was removed during the Apply.
The dialog says how many issues are already in Jira; they are never sent twice. Resume saved Apply carries on from where it stopped. End Apply here keeps what was written, writes nothing more and frees the plan; the rest stay as unapplied edits.
Apply succeeded but nobody got Jira emails
By design: writes are made with Jira notifications turned off.
Nothing to do. Mention it to teams that expect date-change emails.
Jira's history shows the app, not the person
Jira writes are made by the app, and only where the person applying could make the change in Jira themselves.
Expected. The app's audit log records who applied what.
A date changed directly in Jira went back, with a comment
Plan protection (see the first section). The comment names the blocking items, the latest predecessor due date, the earliest allowed start, the requested start and the plan.
Change the date in the plan instead, where the chain re-dates properly.
CarefulThere is no undo for Apply. After a bad Apply, set the dates you want and apply again; the baseline and the vs baseline column show what moved. Nothing in the app restores an earlier Jira state for you.
95Troubleshooting: refresh, access and performance
Empty plans, stale plans, closed plans, missing plans and slow plans.
Symptom
Likely cause
What to do
"No issues indexed" on a new plan
Indexing has not finished, or the sources matched nothing. Indexing runs in the background and can take up to 15 minutes on a large plan.
Press Index Now. If indexing failed, the toast reads "Indexing failed. The plan shows what went wrong." and the plan shows Jira's reason, usually a bad JQL.
"The last re-index matched 0 issues — the previous data was kept. Check the plan's sources."
The sources stopped matching (an edited JQL, a changed board filter, an archived project). A refresh that matches nothing never empties a plan.
Check Plan settings, Sources, then Refresh from Jira now in the plan's ⋯ menu.
The plan looks behind Jira
The hourly refresh skips a plan refreshed in the last 55 minutes, and writes nothing at all when nothing changed. Dependencies added or removed in Jira arrive within seconds, and an open plan checks again every minute.
Refresh from Jira now forces a refresh.
"Could not refresh. Your current plan is kept."
A background refresh could not reach the app's storage. The plan stays on screen.
Try again in a moment.
Every row on the Plans page reads "Updating…"
Right after an update of the app, each plan is measured again under the new rules.
Wait; rows update by themselves, usually within seconds.
A re-index seemed to lose my edits
It should not. Unsaved edits are kept ("This plan was re-indexed — your unsaved edits are kept.") and saved edits are kept too. Where Jira moved the same field, Jira wins and the app names the edit it dropped.
If edits still vanished, check whether someone else applied over the same issues.
A plan is missing from someone's Plans page
A new plan is private by default: only its owner, its members and admins see it.
Add the person on Plan settings, Permissions, or change the plan's default access.
A plan shows as closed
Plans follow Jira's project permissions. A person can open a plan only when Jira lets them see every project and every issue it is built from, including issues with a security level.
Ask a Jira admin for that access, or have the owner or a plan admin narrow the plan's sources.
A person can open the plan but cannot edit
Their plan role is viewer. Save, Apply and dependency changes all need an editor role or above, and Apply also needs their own Jira permissions on each issue.
Make them an editor on Plan settings, Permissions.
The member search finds nobody ("No Jira user matches")
The search asks Jira as you, so Jira's Browse users and groups global permission decides what it finds.
Ask a Jira admin for that permission.
Delete plan is missing
Only the plan's owner or an admin can delete a plan.
Delete plan is in the plan's ⋯ menu and in the row's ⋯ menu on the Plans page.
A very large plan is slow to open
Above 150 rows the Timeline draws only the rows on screen. Opening a plan fetches its items in a few large requests.
If a plan under 150 rows is slow, escalate with the number of items and dependencies.
Old plan data seems to be left in storage
Data of a plan that is no longer in the plan list.
Settings, Maintenance: Scan for orphans, then Clean up KVS. Cleanup refuses ("Refusing to clean up: the plan registry is empty…") when the plan list itself looks lost; do not force it.
A REST call fails on production
The REST API answers only after an admin switches on the app's REST APIs in Atlassian Administration. API tokens from Settings, API Access do not work on production.
See the REST API section for setup.
96Troubleshooting: AI features
AI is on by default. When an AI button does nothing useful, it is usually a switch, a limit, or a plan too large for one request.
Message or symptom
Cause
What to do
"AI features are turned off for this site."
A Jira administrator turned the master switch off.
A Jira administrator can turn it back on in Settings → Maintenance → AI features.
"<Feature> is turned off in the AI features settings."
Only that feature's switch is off; the rest of AI is on.
Same place. The switches are Plan brief, AI structure and Storyline, Read the comments, Review with AI, Build with AI and Propose portfolios.
"Daily AI limit reached" or "Monthly AI limit reached"
The site used its AI actions for the day or month. By default 100 a day and 500 a month. One action is one press of an AI button or one background rebuild, however many model calls it makes.
Wait for the reset, or a Jira administrator raises the limits (0 means no limit).
"Atlassian refused this request: LeanZero Management reached a usage limit Atlassian sets for this site."
A limit set by Atlassian, not by the app.
Try again later.
"This plan is too large to build its storyline in one go"
Reading and measuring the plan used the time one request is allowed, so the AI was not started. Nothing was built and no AI was used.
Narrow the plan's sources, or split the plan.
The Storyline says "Rules updated" and offers Rebuild
It was built under older naming rules.
Press Rebuild.
Read the comments is refused as busy
Another read of the same plan is running. Nothing is charged.
Try again in a minute.
NoteAI is advisory. It never changes a date, a dependency, a rank or anything in Jira by itself. It runs on Atlassian-hosted models through Forge LLMs, and the app declares no connection to any outside service. Settings → Maintenance → AI features shows, per feature, what it sends to the AI.
97Messages, by exact wording
Strings as they appear on screen, so a ticket can be matched to a cause. Angle brackets mark the parts that change.
Warnings and errors
Message
Means
Action
<KEY> must start the working day after <PRED> finishes — on <date>. Cannot move before.
A dependency pulled your edit back to the required start. With a lag the sentence reads "N working days after".
Move the predecessor, or change the lag.
… Cannot move after: a linked task starts on that day, not later. To start it later, change the link's lag or move <PRED>.
A drag later than the link allows.
As the message says.
<KEY> is held to start no earlier than <date> — on <date>. Cannot move before.
A start-no-earlier-than hold.
Move the hold.
N work items snapped to respect dependency rules
Several items were pulled back in one pass.
Open Why did this move?.
<A> already blocks <B>.
The link exists.
None.
<A> cannot depend on itself.
A link to the same item.
None.
… so this link closes a loop.
The link would close a dependency loop.
Remove the opposing link first.
N work items couldn't be saved — not in the plan index yet. Re-index the plan.
The items are newer than the plan's last index.
Refresh from Jira now, then Save.
Save failed: <reason>
Saving to the plan failed. Nothing reached Jira.
Retry; capture the reason if it repeats.
Draft was not saved. <reason>
Your draft autosave failed.
Keep the plan open and retry Save.
Couldn't save lag: <reason> — reverted.
A lag on an existing link was not saved, and the dates it moved were put back.
Set the lag again.
Someone changed the lag <A> → <B> to N working days since you opened it. Nothing was saved.
Another person changed that lag first.
Decide which lag is right and set it again.
Jira is rate-limiting link changes right now, …
Jira refused the link change for now. Nothing changed.
Try again after the number of seconds the message gives.
Your Jira account may not <edit|link> <KEY> (Jira's <permission> permission), so nothing will be written for it.
A row the Apply review refused.
Grant the Jira permission, or let someone who has it apply.
Jira could not confirm what your Jira account may change. Apply asks again before writing anything.
The permission check got no answer.
Retry shortly.
Applied N · M couldn't be written to Jira — still staged, Apply again to retry
Some link, unlink or rank changes were refused.
Fix the cause; they are still staged.
Plan is locked by <name>
Someone else's Apply holds the plan.
Wait for it to finish.
<day> is not a working day on this plan's calendar: …
A due date on a non-working day. It stays; the work after it starts on the next working day.
None, unless the date is wrong.
Indexing failed. The plan shows what went wrong.
Indexing hit a hard error.
Read the reason on the plan; usually a bad JQL or a permission gap.
The last re-index matched 0 issues — the previous data was kept. Check the plan's sources.
The sources stopped matching.
Fix the sources.
Couldn't create the plan — check the source (JQL / board / project) is valid and try again.
Plan creation was refused.
Check the source in the wizard.
Indexing may have failed. You can retry from the plan view.
The wizard stopped waiting without a result.
Open the plan and press Index Now.
Indexing is taking a while — it will finish in the background. You can open the plan now.
Normal for a large plan.
Open the plan; it fills in.
Could not refresh. Your current plan is kept. <reason>
A background refresh failed.
Retry in a moment.
No Jira user matches “<name>”.
The member search found nobody you may see.
Check Jira's Browse users and groups permission.
Refusing to clean up: the plan registry is empty but N plan(s) still have data in storage.
Cleanup saw a lost plan list, not orphaned data, and deleted nothing.
Do not force it. Escalate.
Confirmations
Message
Means
Saved N work items to plan
Saved to the plan. Not in Jira.
Your staged links are saved in your draft. Apply writes them to Jira.
Only dependency changes were pending.
Applied N changes
Links, unlinks or rank changes reached Jira.
All changes discarded
Discard All finished.
This plan was re-indexed — your unsaved edits are kept.
Fresh Jira data loaded around your edits.
This plan changed in Jira. Your edits are kept — refresh when you are ready to merge.
A change arrived from Jira while you have edits. Nothing was overwritten.
<Name> applied changes to this plan. Your edits are kept — refresh when you are ready to merge.
The same, after a colleague's Apply.
<Name> applied changes — refreshing to the latest.
A colleague applied and you had nothing unsaved, so the view refreshed.
This plan changed in Jira — refreshing to the latest.
A Jira change with nothing unsaved on your side.
Dates recalculated for new working day schedule
A calendar change re-ran the schedule.
Calendar set to "<preset>" / Custom calendar "<name>" applied
The plan's working days changed.
Reordered N work items to tidy dependencies — review them in Apply
The reorder suggestion was accepted; the rank changes are staged.
No changes to save / No changes to write
Nothing is staged.
98Frequently asked questions
The questions customers ask most, including the uncomfortable ones.
Does the app change my Jira issues automatically?
Not for scheduling. Every date, duration, buffer, dependency and rank change is staged and reaches Jira only when someone presses Apply. Two things write without Apply: Plan protection putting back an out-of-app start-date change that breaks a dependency (and commenting on the issue), and the first index creating the "PPM Duration" and "PPM Buffer" fields when they do not exist.
Is AI on by default?
Yes. AI is on for every site unless an administrator turns it off. A Jira administrator can switch it all off with one master switch, switch off single features (Plan brief, AI structure and Storyline, Read the comments, Review with AI, Build with AI, Propose portfolios), or cap it: by default 100 AI actions a day and 500 a month for the whole site, where 0 means no limit. Only Jira administrators can change these settings, in Settings → Maintenance → AI features. AI is advisory and never writes a date, a link or a rank.
Is my data sent anywhere outside Atlassian?
No. The app runs on Atlassian Forge and declares no connection to any outside service. The AI features run on Atlassian-hosted models through Forge LLMs. Publishing a report to Confluence uses your own Confluence permissions.
Can I undo an Apply?
No. Undo and Redo (up to 50 steps) only cover changes that are not in Jira yet. After a bad Apply, set the dates you want and apply again.
Who appears as the author of the change in Jira?
The app. Writes are made by the app, with Jira notifications off, but only where the person applying could make the same change in Jira. The app's audit log records who applied what; a Jira administrator reads it through the REST API.
What Jira permissions does someone need to Apply?
Edit Issues for dates, Duration or Buffer, plus Schedule Issues when the change sets Jira's Due date. Link Issues on both issues to add a dependency and on at least one to remove it. Edit Issues and Schedule Issues for rank changes. Browse Projects on every issue touched.
Who can see a plan?
A new plan is private: its owner, its members and admins. On top of that, plans follow Jira's project permissions: a person opens a plan only when Jira lets them see every project and issue it is built from.
Does it work with team-managed projects?
Reading, yes. Writing depends on the fields: a team-managed project owns its own fields, so Duration and Buffer are often not available there and cannot be stored. Configure fields in the plan's ⋯ menu shows what the plan cannot update.
What happens if two people edit the same plan?
Each person's unsaved edits are their own draft. Saving makes them part of the shared plan. Only one Apply runs at a time; a second one waits. If shared values changed since you started, the Shared schedule differs dialog asks before anything is written, and dates a colleague computed for a dependency they have not applied are held back from your Apply.
Does the app reorder my backlog?
Only if you ask it to and then apply. Row order on the Timeline is a view setting. Rank changes are staged like any other change.
Which Jira link type counts as a dependency?
"Blocks" by default; it can be changed on the admin Calculation Engine tab (Issue Link Type Name). The "is blocked by" side is the predecessor. Other link types are ignored by the schedule.
Can I change which Jira fields the app uses?
Yes, on the admin Field Mapping tab, and per plan with Configure fields in the plan's ⋯ menu. The first index usually detects the fields your site already has.
Does the app support lag or lead?
Lag, yes: a whole number of working days on a link, 0 or more. Lead (negative lag) is not supported. A lag belongs to the Jira link, so a link removed and drawn again starts with no lag.
Where did the health score and the weighted % complete go?
Both are gone. "% done" is now a plain count: the share of work items that are done. The Health check lists what stops the forecast, what says something untrue and what limits what can be judged, and the Dashboard's How sure is that date? gives a score out of 100 from six checks of the plan's own data.
Does it level resources?
No. The Capacity tab holds one team roster per plan with each person's weekly hours and shows over-committed weeks. It never moves a date or changes an assignee.
Can I export?
Yes. Export CSV in the plan's ⋯ menu, and the Export CSV and Health report downloads under Model details on the Dashboard. A cell that starts with =, +, - or @ is written as text, so a spreadsheet never runs it as a formula.
Can I switch off the hourly refresh?
Not from the app. An unchanged plan costs almost nothing: the refresh writes nothing when nothing changed.
What happens if I uninstall the app?
What was applied stays in Jira, and the "PPM Duration" and "PPM Buffer" fields stay on the site. Plans, drafts, baselines, calendars, targets and reports live in the app's own storage, and a backup of all of it stays in Jira on your site, readable by Jira administrators only, so a reinstall can restore it. Settings, Maintenance, Delete backup removes it.
Can I use API tokens?
Not on production. The REST API works through Atlassian's app REST APIs with an OAuth 2.0 integration, after an admin switches it on. Settings, API Access shows how.
99Glossary
The words the app uses on screen.
Apply
Writing staged changes to Jira. The button reads "Apply N changes".
Baseline
A frozen copy of the schedule. The Timeline draws it as a grey bar and the Table compares against it in vs baseline. It never changes the schedule.
Buffer
An item that absorbs slip: when a predecessor pushes into it, its due date holds and it gets shorter, so later work does not move. Drawn with amber stripes; violet stripes when used up.
Can't tell yet
The plan status when less than 80% of the commitment's open work has dates and the plan would otherwise read On track, Tight or Not started. On-time cannot be proven from partial data.
Dated share
The share of open work that has both a start and a due date. Shown as, for example, "24% of the open work".
Draft
Your unsaved edits on a plan, kept per person and restored after a reload.
Health check
A sheet, opened from Can I trust these numbers? or the plan's ⋯ menu, that lists what stops the forecast, what says something untrue and what limits what can be judged. Each finding has a count, a sentence and its fixes. It never writes to Jira.
Hold
A start-no-earlier-than date on an item. The schedule respects it and refuses an earlier move. Set through the REST API.
Lag
Extra working days between a predecessor's finish and a successor's start, on one link. 0 or more.
Late (at least)
The plan status when less than 80% of the commitment's open work has dates but the dated work alone already finishes after a target that is still ahead. The gap shown is a lower bound.
Milestone
An item whose start equals its due and whose Duration is exactly 0 or whose type is Milestone. Drawn as a diamond.
Needs attention
A view of the Timeline (and of the Plans page) that groups what needs a decision by reason, worst first.
Plan brief
The side panel beside a plan: the headline, the decisions needed, what to do next, what changed and the numbers, all computed by the app. The AI drafts a short status update in which every sentence is traced to a computed fact. It replaced Explain.
Plan protection
Puts back a start date changed directly in Jira when it breaks a dependency or a hold, and comments on the issue.
Room
The working days an item can slip before the plan's finish moves. 0 means it sets the finish.
Sets the finish
The items with 0 working days of room: the chain that decides the plan's finish. Outlined on the Timeline; the toolbar button shows just that chain.
Sponsor report
A report for a sponsor, opened with Prepare sponsor report as an editable draft for an internal or external audience. Each send (download, Confluence or copy as text) seals a numbered version that never changes.
Staged
Changed in the app but not yet in Jira. Anything Jira refuses on Apply stays staged so it can be retried.
Storyline
A tab that tells a long plan as a few storylines, each in a few beats, and marks the one that threatens the finish. Built with the AI structure and Storyline feature.
Target
A date the plan is measured against (Plan settings, Targets), for the whole plan, an epic or a release. The commitment is the target the plan's status is judged by.
The real plan
The Timeline's first view: epics that hold work, other dated work grouped by quarter or month, and undated loose work folded into one row.
Timeline
The plan's chart of bars over time, formerly the Gantt tab.
Work item
The unit every count uses. An epic with no stories yet counts as a work item; an epic that holds stories does not, because its stories are counted. The Table counts rows.
100Every number in one place
Defaults, limits and thresholds as the code sets them.
AI
Setting
Value
AI on a new site
On
AI actions per day (site)
100 by default; 0 = no limit
AI actions per month (site)
500 by default; 0 = no limit
Repeat of the same AI request
Answered from a 10-minute cache at no cost
AI actions over the REST API, per person
20 every 10 minutes and 200 a day
Read the comments
Up to 12 open work items, the 3 newest comments each, cut to 300 characters
Applying to Jira
Setting
Value
Changes in one Apply
1 to 10,000
Plan write lock
5 minutes, renewed while the Apply runs
Retries on a Jira error
4 attempts, starting at 2 seconds and never more than 30 seconds apart; a 429 waits as long as Jira asks
Jira notifications on Apply
Off
Indexing and refresh
Setting
Value
Scheduled refresh
Every hour
Skip a plan refreshed within
55 minutes
Background index time limit
900 seconds (15 minutes)
Open plan checks for changes
Every 60 seconds
Jira page size when indexing
100 issues per request
Editing
Setting
Value
Draft autosave
1.5 seconds after you stop editing
Untouched draft cleared after
24 hours
Undo and Redo
Up to 50 steps
Timeline draws only visible rows above
150 rows
Targets per plan
Up to 24, name up to 80 characters
Status thresholds
Setting
Value
Dated share below which a plan reads Late (at least) or Can't tell yet
80% of the commitment's open work
Dated share below which a status is Low confidence (outlined chip)
50% of the open work
At risk on the Timeline
5 working days of room or fewer
Tight
10 working days of room or fewer before its target
Audit log
Setting
Value
Audit log kept for
60 days
Routine audit entries per day
500 per person, 3,000 for the site (writes to Jira and changes to access and AI settings are always recorded)
Field and engine defaults
Setting
Default
Notes
Dependency link type
Blocks
"is blocked by" = predecessor
Start date field
customfield_10015
Usually replaced by detection at the first index
Due date field
duedate
System field
Duration field
customfield_11581
Created as "PPM Duration" if nothing matching exists
Buffer field
customfield_12399
Created as "PPM Buffer" if nothing matching exists
Rank field
customfield_10019
Written through Jira's rank API
CarefulOn the admin Calculation Engine tab, Max Dependency Graph Depth and Max Issues in Single Calculation are not read by the scheduling engine. Changing them does not change a plan.
101What to collect before escalating
The evidence that turns a vague report into something reproducible.
Always capture
1The app version from the header (the same number Manage apps shows), and the plan's name.
2The exact message, word for word. Most messages come from one place in the app.
3Where the change was: only in the draft (Save (N)), saved (Saved), or applied (Apply N changes gone).
4The issue keys involved and, for a scheduling complaint, the predecessors of the item that misbehaved.
5What the Health check and Plan info say about the plan, including items it cannot update in Jira.
6Whether the plan's projects can store Duration and Buffer (Configure fields in the plan's ⋯ menu). This one fact explains many write and milestone reports.
7For a question about who did what, the audit log entries: a Jira administrator reads or downloads the log through the REST API.
Habits that pay off
When the screen contradicts what you expect, capture the browser console before theorising.
When a symptom shows in one place, check whether the same number reads differently elsewhere. Every page is meant to show the same numbers for a plan; a difference is a defect worth reporting.
An empty list, a 0 count or a missing plan is not proof until you know the person can see the thing at all. Plans follow Jira permissions, so a closed or missing plan is often an access question.
LimitProduction has no test hook. Diagnose a customer's site from the messages above, the plan's own status, the Health check and the audit log.
How it is built
A React custom UI talking to Forge resolvers, with plan data sharded across Atlassian's key-value store so a plan of several thousand issues stays inside the platform's limits. Indexing runs on a queue, dependency changes made in Jira arrive within seconds, and an hourly refresh keeps everything else in step.
The scheduling engine exists twice: once in the browser, where it has to be instant, and once on the server. A parity test suite settles the same plans through both and fails the build if they disagree, so what you preview is what gets applied.
Try LeanZero Management
Free. Install it from the Atlassian Marketplace and point it at a project you already run: it schedules the issues that are there, on the start and due dates they already carry, and adds its own PPM Duration and PPM Buffer fields only if your site has no such fields.