96 GB is 77.76 GiB: the real memory ceiling on an M3 Ultra
Mihai Perdum
Author
13 min readAugust 13, 2026
Key takeaways
Metal on this 96 GB M3 Ultra reports a 77.76 GiB working set, not the 72 GiB the widely repeated 75% rule predicts. Read the number off your own box; the ratio is not a constant.
There is a third ceiling nobody mentions: a single Metal buffer here caps at 58.32 GiB, exactly 75% of the working set.
Hybrid attention has moved the ceiling. All four local models I measured fit at full 262,144-token context; every one of them would blow past 77.76 GiB if its layers were classic full attention.
mlx-lm's rotating cache holds window + prefill_chunk - 1 tokens, so Gemma 4's 1024-token sliding window occupies 3,071 tokens per layer at the default prefill step. Dropping the chunk to 256 gives back 1.37 GiB.
Gemma 4's unified keys and values save nothing in mlx-lm 0.31.3 — the cache stores K and V as two separate arrays, so 10 GiB of Google's own design saving is left on the floor at full context.
I have been sizing local models the same wrong way for about a year: take the weights, subtract from the RAM on the sticker, call the difference headroom. That arithmetic is wrong twice over on Apple Silicon. The RAM on the sticker is not what the GPU is allowed to touch, and the thing that eats the rest is no longer the thing it used to be.
So I sat down at the Mac Studio and measured all of it — the ceilings the hardware actually enforces, and what four models I already have on disk genuinely spend against them at full context. Some of what came back I did not expect, including a cache that holds three times the window it advertises, and a memory optimisation Google designed into Gemma 4 that the Apple Silicon runtime silently declines to use.
The three ceilings, not one
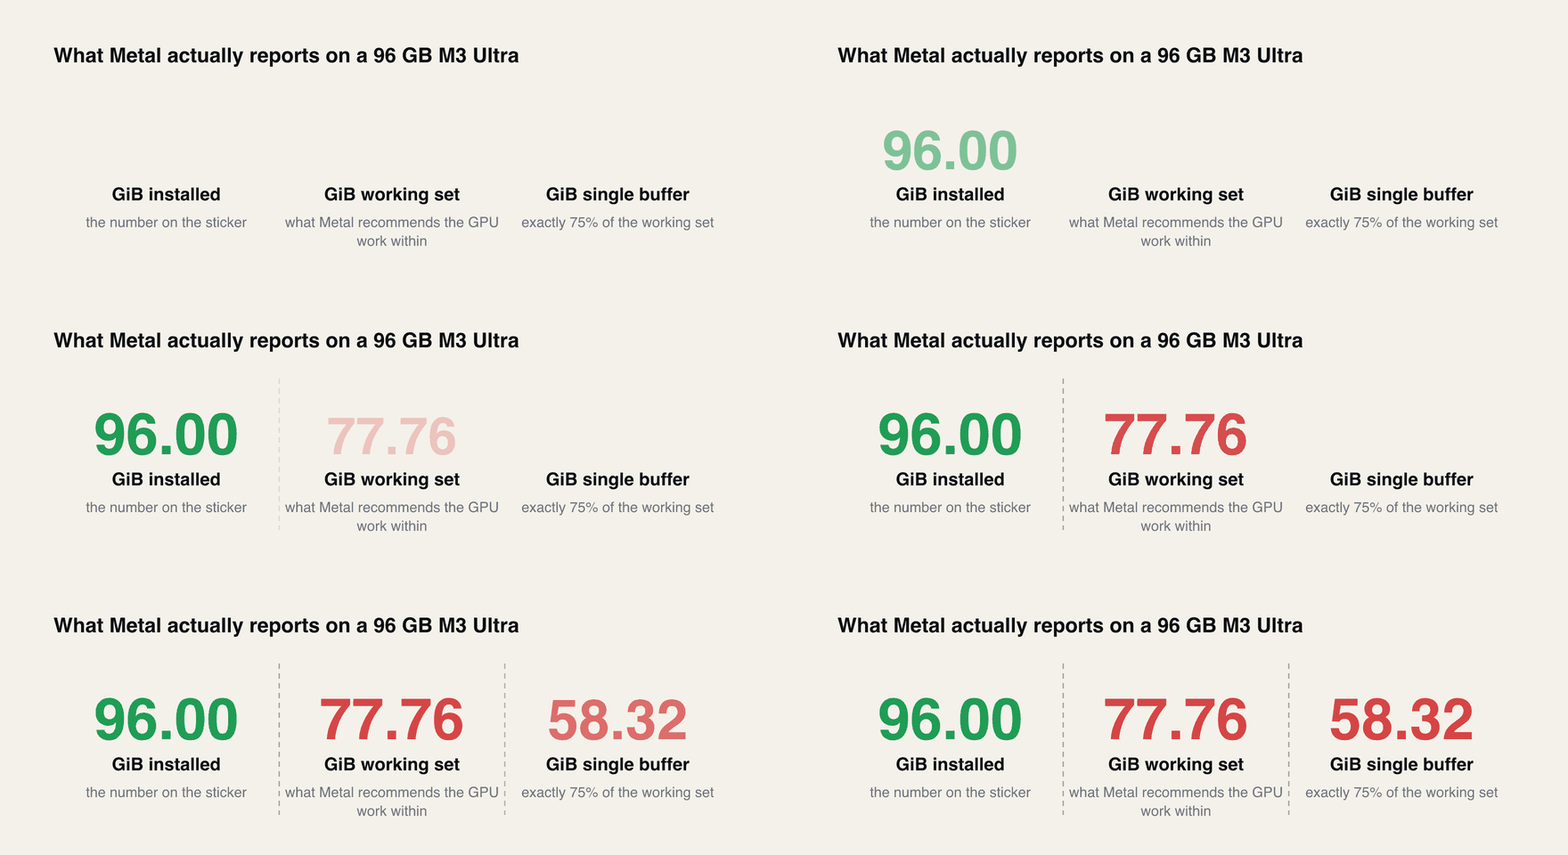
The box is a Mac Studio, M3 Ultra, 96 GB unified memory, macOS 26.6.1. Here is what Metal says about it:
Three numbers, not one. The 18.24 GiB between the first two is memory you paid for that a model is not supposed to live in.
python
1import mlx.core as mx
2d = mx.device_info()3for k in("memory_size","max_recommended_working_set_size","max_buffer_length"):4print(f"{k:34s}{d[k]:>14,}{d[k]/1024**3:8.2f} GiB")
Three numbers, and the gap between the first two is the whole game. 96.00 GiB is installed. 77.76 GiB is what Metal recommends the GPU work within. That is 18.24 GiB of unified memory that exists, that you paid for, and that a model is not supposed to be living in.
The third number is the one I had never seen anyone mention: a single Metal buffer on this machine caps at 58.32 GiB, which is exactly 75.00% of the working set. For transformer weights this rarely bites, because the weights arrive as hundreds of per-tensor buffers and no individual one gets near it. But it is a real ceiling, it is a third of the way below the physical RAM, and if you are allocating one enormous contiguous thing it is the wall you hit first. I am reporting what the device advertises here — I did not try to force an allocation past it on a machine that was doing other work.
The 75% rule is not a rule
Every guide I have read on raising the Apple Silicon VRAM cap states the default as 75% of unified memory. On a 128 GB machine that checks out — the commonly quoted figure is about 96 GB, and 96/128 is exactly 75%.
On this 96 GB machine it is not 75%. It is 81.00%:
text
183,494,174,720 / 103,079,215,104 = 0.8100001
The 75% rule would have predicted 72.00 GiB. The box actually offers 77.76 GiB. That is 5.76 GiB of difference, which is not a rounding error — it is a whole extra quantised 7B, or a third of the KV cache of a 27B at full context.
I want to be precise about what I am claiming, because this is the sort of thing that gets over-generalised into a new piece of folklore. I measured one machine. What I can say is that the ratio is not a fixed 75% across configurations, so deriving your ceiling from a percentage is a mistake in either direction. Print max_recommended_working_set_size on the machine in front of you and use that number.
You can raise it — sudo sysctl iogpu.wired_limit_mb=<N> takes effect immediately with no reboot, and both sysctls read 0 (meaning default) on this box. That is a separate decision with its own consequences, and it is not what this piece is about. Everything below assumes the default, because that is what a reader's machine is doing right now.
Weights are the easy part
Here is the arithmetic I grew up with. A classic transformer's KV cache is layers × kv_heads × head_dim × 2 × bytes per token, and it grows linearly and forever. For a 64-layer model with 4 KV heads at head dimension 256 in bf16, that is 256 KiB per token. At a 262,144-token context that is 64 GiB of cache — on top of the weights. On a machine that will only hand the GPU 77.76 GiB, a 27B model at its own advertised context was simply not a thing you could do.
That is the world the "just buy more RAM" advice comes from, and it is out of date. Every model I have on disk that is worth running now uses hybrid attention: most layers carry a fixed-size recurrent state instead of a growing cache, and only a minority do full attention. Qwen3-Coder-Next is 80B total with 3B activated across 48 layers, arranged as three Gated DeltaNet blocks for every one Gated Attention block. Gemma 4 interleaves a short sliding window with occasional global layers. I have written before about how Qwen3-Coder-Next behaves on this hardware when Ling 3.0 Flash would not load at all; this is the memory half of that story.
So I stopped reasoning about it and measured it.
What I actually measured, and how
Two passes, deliberately, so the second could be checked against the first.
Pass A loaded a real model with mlx_lm.load, ran real prefill at growing context, and then walked the cache objects that make_cache() had built, layer by layer, summing array.nbytes. That is ground truth, but it costs a full model in memory.
Pass B built the same cache objects from each model's own config.json — using the construction rules read out of the mlx-lm source, not guessed — filled them, and measured what MLX allocated. No weights, so it runs for any model whether or not it fits alongside whatever else is resident.
The point of doing both is that Pass B is only worth anything if it reproduces Pass A. It does, exactly. For Qwopus3.6-27B-Coder-6bit, Pass A on the loaded model reported 84,328 bytes per token at 8,192 context and a flat 146.8 MiB of recurrent state; Pass B reported 84,328 bytes per token and 146.8 MiB. Same at 32,768. Identical to the byte, which is what you want from a structural measurement — these are allocation sizes, not timings, so they are deterministic and they do not care what else the machine is doing.
Versions matter here and both are current as I write: mlx 0.32.0, mlx-lm 0.31.3, which is the latest release on PyPI.
The cache, per architecture
Measured allocations at each context, for the exact quantised MLX builds sitting on this disk:
Model
Layers (linear / full)
Cache @ 32k
Cache @ 128k
Cache @ 262k
Marginal
Qwen3-Coder-Next 6-bit
36 / 12
0.82 GiB
3.07 GiB
6.07 GiB
24 KiB/tok
Qwen3.6-27B 8-bit
48 / 16
2.14 GiB
8.14 GiB
16.14 GiB
64 KiB/tok
Qwopus3.6-27B-Coder 6-bit
48 / 16
2.14 GiB
8.14 GiB
16.14 GiB
64 KiB/tok
Gemma 4 31B 8-bit
50 sliding / 10 global
4.84 GiB
12.34 GiB
22.34 GiB
80 KiB/tok
5 rows × 6 columnsHeader row enabled
One caveat on that last row, and it turns into the next section. The three Qwen figures are independent of how you feed the prompt in — I confirmed that by getting byte-identical results from Pass A, which prefilled in 2,048-token chunks, and Pass B, which pushed the whole context in at once. The Gemma row is not. It is quoted at mlx-lm's default prefill chunk of 2,048, and it moves if you change that.
Two things jump out.
The first is that the recurrent state genuinely is free. For the Qwen hybrids the linear layers hold a fixed 73.7 MiB (Coder-Next) or 146.8 MiB (the 27Bs) and that number does not move between 8,192 tokens and 262,144 tokens. Not "grows slowly" — identical, because a Gated DeltaNet layer's state is a fixed (v_heads, k_dim, v_dim) tensor plus a four-tap convolution window. Three quarters of the network stopped caring about context length.
The second is that Gemma 4 has the largest cache of the four, which is not where I expected a sliding-window model to land. That took some digging, and it is the interesting part.
Trap one: the sliding window is not the sliding window
Gemma 4 31B's config declares sliding_window: 1024. Fifty of its sixty layers are sliding-attention layers, so the naive expectation is that those fifty layers hold 1,024 tokens each, forever, no matter how long the context gets. Fifty layers × 16 KV heads × 256 head dim × 2 (K and V) × 2 bytes × 1,024 tokens = 0.78 GiB, flat.
I measured 2.34 GiB. Three times too much.
That is not a harness bug — it is written down plainly in mlx_lm/models/cache.py:
python
1# The largest size is self.max_size + S - 1 to ensure2# every token gets at least self.max_size context3trim_size = self._idx - self.max_size +1
S is the prefill chunk size. The rotating cache has to hold the window plus the whole chunk you just pushed into it, minus one, or the last token in that chunk would see less than a full window of history. It is correct behaviour. It is also invisible unless you go looking, and it means the memory a sliding-window model uses is set by your prefill step size, not by the model's config.
I swept it directly, filling to 32,768 tokens each time and reading back what the fifty sliding layers held:
Prefill chunk
Tokens held per layer
window + chunk - 1
50 layers
256
1,279
1,279
0.98 GiB
512
1,535
1,535
1.17 GiB
1,024
2,047
2,047
1.56 GiB
2,048
3,071
3,071
2.34 GiB
4,096
5,119
5,119
3.91 GiB
8,192
9,215
9,215
7.03 GiB
7 rows × 4 columnsHeader row enabled
Exact, every row — window + chunk - 1, no exceptions. And the default matters: generate_step in mlx_lm/generate.py declares prefill_step_size: int = 2048, so out of the box those fifty layers hold 3,071 tokens each rather than the 1,024 the config advertises — the 2.34 GiB above, where the window implies 0.78 GiB. (speculative_generate_step defaults to 512 instead, so a speculative run and a normal run of the same model do not use the same amount of memory.)
Tip
If you are running Gemma 4 on Apple Silicon and you are tight on memory, drop prefill_step_size to 256. It hands back a measured 1.37 GiB against the default. It should cost you prefill throughput, since you are giving up batch width — I have not measured how much, for the reason in the last section. That is a knob nobody is turning because the config file makes it look like the window already settled the question.
Trap two: the unified K/V that isn't
Google's own description of Gemma 4 says that to optimise memory for long contexts, the global layers use unified keys and values. That is real and it is in the config as attention_k_eq_v: true. The mlx-lm implementation honours it on the compute side — in gemma4_text.py the value projection is not even constructed, and the forward pass does literally values = keys.
And KVCache.update_and_fetch allocates new_k and new_v as two separate arrays and writes into both. So on the global layers, mlx-lm stores two identical copies of the same tensor.
I did not want to take that from reading alone, so I handed a bare KVCache the same array twice, exactly as the model does:
python
1c = KVCache()2k = mx.zeros((1,4,1024,512), mx.bfloat16)# gemma 4 global-layer shape3c.update_and_fetch(k, k)4mx.eval(c.keys, c.values)56c.keys is c.values # False — two distinct allocations7mx.all(c.keys == c.values)# True — holding identical content8c.keys.nbytes + c.values.nbytes # 8,388,608 → 8,192 bytes per token per layer
Two distinct arrays, byte-identical content. Ten global layers × 4 global KV heads × 512 global head dim × 2 arrays × 2 bytes = 81,920 bytes per token, and 81,920 × 262,144 is exactly 20.00 GiB — which is the global-layer share of the 22.34 GiB Gemma total in the table above, the other 2.34 GiB being the fifty sliding layers from trap one. Exploiting k_eq_v in the cache would make that 40,960 bytes per token — 10 GiB instead of 20 GiB at full context.
In the interest of being straight about method: I verified the call site by reading gemma4_text.py and the duplication by the snippet above. I did not load the full Gemma 4 31B weights to watch it happen end to end, because the machine had another 32 GB model resident throughout and I was not going to evict someone else's running work to get a prettier screenshot. The cache behaviour is deterministic and the shapes come from Gemma 4's own config, so I am confident in the number — but that is where the evidence stops, and you should know it.
To be exact about what this is: it is not a correctness bug, the model produces the right answer, and the weight saving from dropping v_proj is real. But the memory half of Google's optimisation — the half aimed squarely at long context — is not being realised on this runtime. Ten gigabytes on a machine with a 77.76 GiB ceiling is 13% of everything the GPU is allowed to touch, spent storing a second copy of something the code already knows is identical.
I checked that I was not reporting a stale bug: mlx-lm 0.31.3 is the current release, and this is what 0.31.3 does.
The ceiling moved
Now put the weights back in. Weights are exact safetensors bytes on disk; cache is measured at the model's native 262,144-token context; the ceiling is the 77.76 GiB Metal reported.
Model
Weights
Cache @ 262k
Total
% of 77.76 GiB
Qwen3-Coder-Next 6-bit
60.30 GiB
6.07 GiB
66.38 GiB
85.4%
Gemma 4 31B 8-bit
31.44 GiB
22.34 GiB
53.79 GiB
69.2%
Qwen3.6-27B 8-bit
27.48 GiB
16.14 GiB
43.62 GiB
56.1%
Qwopus3.6-27B-Coder 6-bit
21.21 GiB
16.14 GiB
37.36 GiB
48.0%
5 rows × 5 columnsHeader row enabled
All four fit, at full native context, on a 96 GB Mac. That is the headline and it is a genuinely new state of affairs.
Now the counterfactual. Take each model and imagine its layers were all classic full attention — same head configuration, no linear layers, no sliding window — which is what a model of that shape would have looked like eighteen months ago:
Model
Weights + full-attention cache @ 262k
Fits in 77.76 GiB?
Qwen3-Coder-Next 6-bit
84.3 GiB
No
Qwen3.6-27B 8-bit
91.5 GiB
No
Qwopus3.6-27B-Coder 6-bit
85.2 GiB
No
Gemma 4 31B 8-bit
151.4 GiB
No
5 rows × 3 columnsHeader row enabled
For the Qwen rows that means scaling the full-attention layers up to all layers at the same head configuration. For Gemma it means all sixty layers behaving like its global layers — 4 KV heads at head dimension 512 — which is the fair comparison, since its sliding layers are the very thing being hypothesised away.
Not one of them. Every model in that first table fits because of its attention design, not because of its quantisation and not because of the RAM. Qwen3.6-27B at 8-bit would need 64 GiB of KV cache alone; it needs 16.14.
So the practical shape of the ceiling has inverted. It used to be that you picked a model that fit and then discovered you could not give it any context. Now the cache is cheap enough that the weights are the binding constraint again, and the question "what runs on 96 GB" is close to just "what weighs less than about 60 GiB" — the 77.76 GiB ceiling, less the cache, less whatever else on the machine is already charged to it. That is the question it was before long context existed. Qwen3-Coder-Next is the interesting case precisely because it is the only one of the four where the total gets genuinely close — 85.4% of the ceiling, 11.39 GiB of headroom, and that headroom is what everything else on your Mac has to live in.
If you do need the cache smaller, mlx-lm will quantise it. This is the same Qwen3.6-27B at 128k, measured:
Setting
Cache
Per token
Reduction
bf16 (default)
8.00 GiB
64.0 KiB
1.00x
--kv-bits 8
4.25 GiB
34.0 KiB
1.88x
--kv-bits 4
2.25 GiB
18.0 KiB
3.56x
4 rows × 4 columnsHeader row enabled
Note that 8-bit gives 1.88x, not 2x. At the default group size of 64 each group carries an fp16 scale and an fp16 bias, so the real cost is bits + 32/64 per weight — 8.5 bits, not 8. 16/8.5 = 1.88 and 16/4.5 = 3.56, which is exactly what came back. If you have budgeted for a clean halving you are 6% short.
I am reporting size here and not quality. What --kv-bits 4 does to output on a long agentic run is a separate measurement and I have not made it, so do not read this table as a recommendation.
What I did not measure, and why
I did not publish a tokens-per-second number in this piece, and I want to be plain about that rather than quietly omit it.
I tried. Pass A timed prefill and decode at each context, and the numbers came back at 6.6, 3.75 and 1.26 tokens/sec for decode — absurdly low for a 27B on an M3 Ultra. Then I checked lms ps and found the reason: this Mac is a node in a local model swarm, and partway through my run the local node went from IDLE to GENERATING. Its llama-server was holding 53.4 GiB resident — a 32 GB model plus its KV cache. My own peak of 27.9 GiB on top of that is 81.3 GiB against a 77.76 GiB working set, and vm.swapusage showed 10.2 GB of swap in use. I was benchmarking a swapping machine.
Those numbers are rubbish and they are not in this article. The memory figures are, and they are unaffected — every one of them is an allocation size read out of MLX's own allocator or off the filesystem, deterministic and indifferent to what else is running. Timings are the thing contention destroys, which is exactly why I have kept throughput comparisons on this box to their own dedicated runs.
There is a lesson in the accident, though. The ceiling is not per-process. Metal's 77.76 GiB is the budget for everything the GPU is doing, and a resident model you forgot about is charged to it in full. My swarm node was holding 53.4 GiB — 69% of the entire GPU budget — for a 27B that was sitting idle at the time. If you are sizing a model against 77.76 GiB, you are sizing against what is left of 77.76 GiB, and on a working machine that can be a third of it.
What I would tell someone sizing a Mac today
Read the ceiling off the machine rather than off a percentage — mx.device_info()["max_recommended_working_set_size"], once, and write it down. Subtract what is already resident, because it counts against you.
Then stop budgeting for the KV cache the way you used to. On the current generation of hybrid-attention models it is between 6 and 22 GiB at a quarter-million tokens of context, where the equivalent classic architecture would have wanted 24 to 120, and that changes which models are candidates rather than just how long a prompt you can feed them. Size the weights first now; the cache is no longer the thing that decides.
And check the runtime, not just the model card. Gemma 4's config says its window is 1024 and Google's write-up says its global layers unify K and V. On mlx-lm 0.31.3 the first becomes 3,071 tokens per layer at the default prefill step and the second saves no memory at all. Both are visible in about ten minutes of reading the cache implementation, and neither is visible from the outside. The MLX-versus-GGUF split is full of this kind of thing — the same weights, a different runtime, and a materially different answer to "will this fit".
---
Measured 13 August 2026 on a Mac Studio, Apple M3 Ultra, 96 GB, macOS 26.6.1, with mlx 0.32.0 and mlx-lm 0.31.3. Cache figures are MLX allocation sizes; weight figures are safetensors bytes on disk. The measurement scripts are two files and about 150 lines — the approach is described above in enough detail to rebuild them.