What 145 MCP Tools Cost Before the Model Reads Your Question
Mihai Perdum
Author
14 min readAugust 17, 2026
Key takeaways
Ten real MCP servers, probed on 2026-08-17: not one implements the 2026-07-28 stateless spec. All still answer the initialize handshake, and GitHub's still negotiates 2024-11-05.
145 tools across those ten servers amount to 40,784 tokens of definitions, sent on every request. 81.1% of that is JSON Schema — descriptions are 15.7% and names are 3.2%.
Tool count barely predicts context cost: Pearson r = 0.518, with a 10.2x spread in tokens per tool. 'Use fewer tools' optimises the wrong variable.
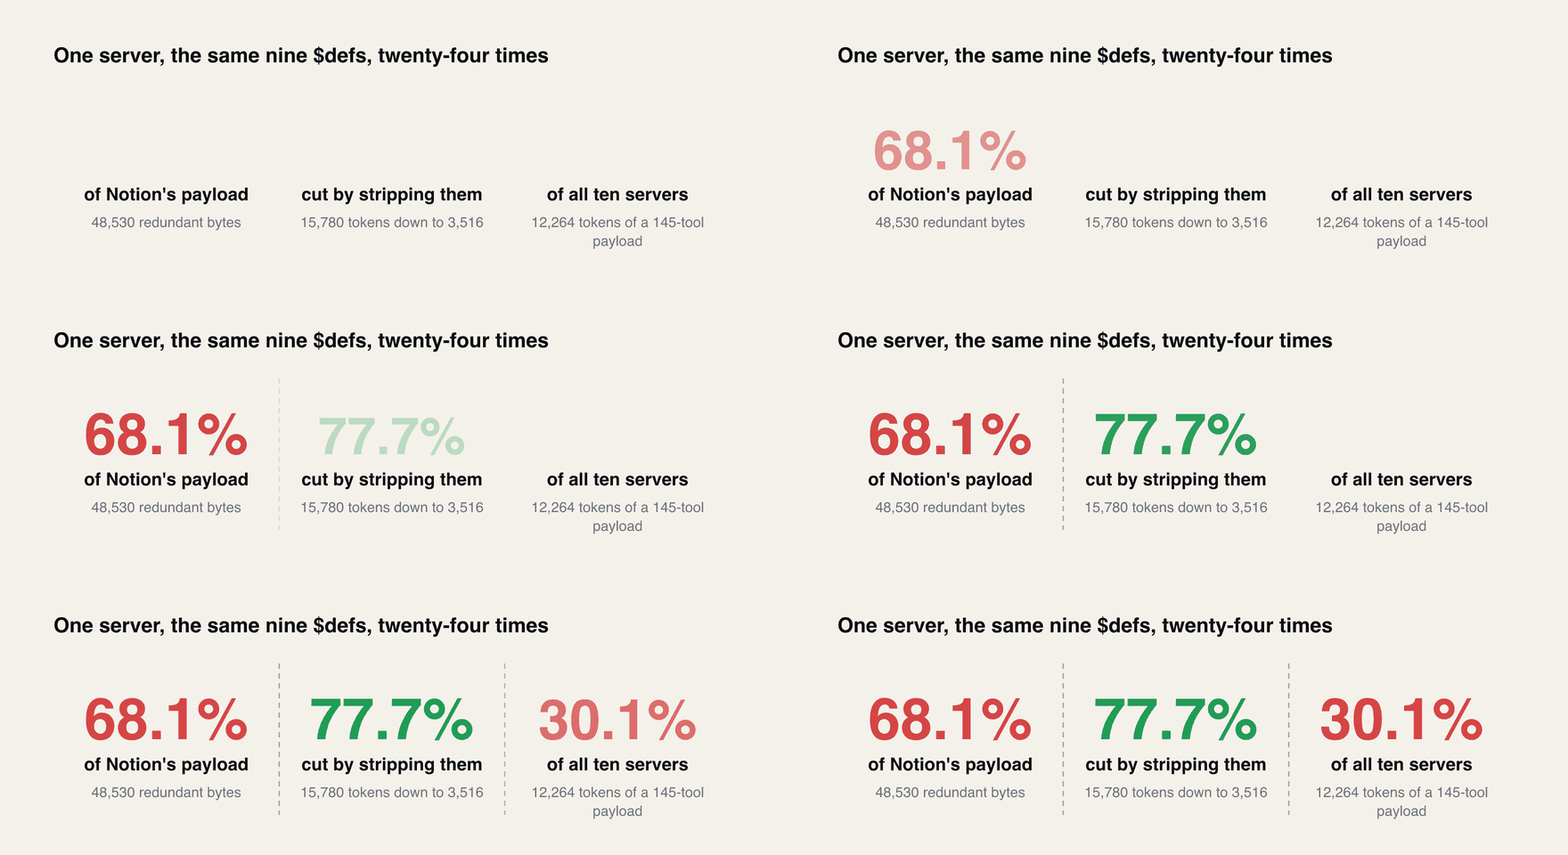
One server accounts for 30.1% of the entire payload by repeating the same nine $defs blocks in all 24 of its tools. Stripping them cuts its schema tokens by 77.7%.
Rendered through the chat template those 145 tools become 51,530 prompt tokens, which on this model reserves 3.16 GiB of KV cache before the conversation starts.
The 2026-07-28 spec is opt-in at the wire on the TypeScript and Go SDKs — upgrading the package does not change what your server speaks.
The Model Context Protocol shipped a new specification revision on 28 July 2026, and it is the biggest change the protocol has had. It removes the initialize / notifications/initialized handshake, removes protocol-level sessions and the Mcp-Session-Id header from the Streamable HTTP transport, and adds a server/discover RPC that servers MUST implement. The word the announcements used was "stateless."
So I did the obvious thing and pointed a client at ten real MCP servers to see what stateless looks like in practice.
None of them implement it. Every single one rejected server/discover with JSON-RPC error -32601, "Method not found", and every single one happily completed the old handshake that the new spec deletes. That is a fine result and I will show the numbers, but it is not the interesting one, because the handshake was never what MCP costs you.
What MCP costs you is the tool definitions. Before the model reads a single word of your question, your client has already sent it every tool from every server you connected. I measured that on ten servers: 145 tools, 40,784 tokens. Then I took that payload apart to find out where the tokens actually go, and the answer is not where the usual advice points.
I have written before about the protocols that govern how an agent behaves — what it must gather before acting, when it must stop and confirm. This is the other half of that question, and the one nobody costs out: what the control surface itself charges you just to exist.
The probe
Everything below comes from a stdio JSON-RPC client I pointed at pinned package versions on 17 August 2026. No mocks, no recalled schemas — the servers were launched, spoken to, and their tools/list responses captured verbatim. The three calls that matter, from that client:
python
1PROTO_NEW ="2026-07-28"2PROTO_OLD ="2025-06-18"34# 1) the stateless path the new spec requires5s.send({"jsonrpc":"2.0","id":1,"method":"server/discover","params":{}})67# 2) the handshake the new spec deletes8s.send({"jsonrpc":"2.0","id":2,"method":"initialize","params":{9"protocolVersion": PROTO_OLD,10"capabilities":{},11"clientInfo":{"name":"lz-newsroom-probe","version":"1.0.0"}}})1213# 3) the payload that actually costs money14s.send({"jsonrpc":"2.0","id":3,"method":"tools/list","params":{}})
Ten servers, all reachable over npx:
server
package
version
server/discover
negotiated version
tools
github
@modelcontextprotocol/server-github
2025.4.8
−32601
2024-11-05
26
playwright
@playwright/mcp
0.0.79
−32601
2025-06-18
24
notion
@notionhq/notion-mcp-server
2.5.1
−32601
2025-06-18
24
kubernetes
mcp-server-kubernetes
4.1.4
−32601
2025-06-18
23
filesystem
@modelcontextprotocol/server-filesystem
2026.7.10
−32601
2025-06-18
14
everything
@modelcontextprotocol/server-everything
2026.7.4
−32601
2025-06-18
13
memory
@modelcontextprotocol/server-memory
2026.7.4
−32601
2025-06-18
9
sentry
@sentry/mcp-server
0.37.0
−32601
2025-06-18
9
context7
@upstash/context7-mcp
4.0.2
−32601
2025-06-18
2
sequential-thinking
@modelcontextprotocol/server-sequential-thinking
2026.7.4
−32601
2025-06-18
1
11 rows × 6 columnsHeader row enabled
Three things worth saying plainly. The newest revision anything here negotiated was 2025-06-18 — not the current 2026-07-28, and not even the previous 2025-11-25. The reference servers published by the protocol's own maintainers are in that list. And GitHub's server is still on 2024-11-05, a revision old enough to vote in protocol years.
To be fair to the maintainers: those four @modelcontextprotocol/* packages were published on 4 and 10 July 2026, which is before the 28 July spec, so they could not have implemented it. That is the point rather than an excuse — a spec three weeks old has an ecosystem still built on packages that predate it, and nothing you can npx today speaks it.
None of them returned the ttlMs and cacheScope fields that the new spec makes required on tools/list results either — every response carried the bare {"tools": [...]} and nothing else.
This is not incompetence, and it is worth understanding why, because it tells you when to expect the change. The MCP maintainers' own SDK announcement is explicit that for the TypeScript and Go SDKs, "upgrading does not by itself change what your server speaks over HTTP. Serving 2026-07-28 is an explicit choice you make when you wire up the transport." The TypeScript v2 packages are new package names — @modelcontextprotocol/server and @modelcontextprotocol/client replacing the monolithic @modelcontextprotocol/sdk — so adopting them is a migration, not a version bump. Python v2 servers answer both revisions from one endpoint and the C# preview defaults to the new stateless mode, but the ecosystem I can actually run over npx is TypeScript, and TypeScript made it opt-in.
So: the stateless spec is real, it is good, and on the evidence of ten servers it has changed nothing yet in the field. Plan for a long tail. If you are writing a client, the old handshake is not a compatibility branch you can drop this year.
The part that actually costs you
Here is the thing the handshake debate obscures. initialize is one round trip of maybe two hundred bytes. tools/list is where the weight is, because whatever comes back gets converted into tool definitions and shipped to the model on every single request for the life of that conversation.
I converted each server's tools/list output into the shape a client actually sends — name, description, JSON Schema, with the mcp__<server>__<tool> namespacing Claude Code uses — and counted tokens with the model's own tokenizer:
server
tools
tokens
tokens/tool
notion
24
16,772
698.8
sentry
9
6,150
683.3
kubernetes
23
5,056
219.8
github
26
3,562
137.0
playwright
24
3,558
148.2
filesystem
14
1,723
123.1
everything
13
1,142
87.8
context7
2
1,021
510.5
memory
9
925
102.8
sequential-thinking
1
898
898.0
all ten
145
40,784
281.3
12 rows × 4 columnsHeader row enabled
Big round numbers circulate for this, usually without a payload attached to them, so here is the one figure with a real source behind it. Anthropic's code execution with MCP post reports going "from 150,000 tokens to 2,000 tokens—a time and cost saving of 98.7%." That figure is real, and it is not this measurement: it describes their Google Drive to Salesforce example end to end, where intermediate tool results also stop flowing through the context window, not the standing cost of tool definitions. Set it against my 40,784 and you are comparing two different things.
Two honest caveats on that table. Ten servers at once is a deliberately maximal configuration — most people run three or four — but the per-server rows are the useful part, because they let you add up your own config instead of trusting mine.
The other is the tokenizer. The count is not an artifact of one: running the same 87-tool payload through four tokenizers I have on disk, Qwen3.6-27B, Qwen3.8-27B and Qwen3-Coder-Next all give 11,795, and Gemma-4-31B gives 12,679 — a 7.5% spread. All four are open-weight, though. A hosted model tokenizes differently and I have no API credentials on this box to check, so if you are budgeting against a commercial API, count it there rather than assuming my number transfers.
Where the tokens actually are
Split the 145 definitions into their three parts and the picture stops being ambiguous:
component
tokens
share
JSON Schema (inputSchema)
31,960
81.1%
descriptions
6,188
15.7%
names
1,253
3.2%
4 rows × 3 columnsHeader row enabled
Those three sum to 39,401 rather than 40,784 — the missing 1,383 tokens are the JSON punctuation holding the payload together, which your client also sends. The shares are of the 39,401.
Four fifths of your tool-definition budget is machine-generated JSON Schema. The prose a human wrote to explain what the tool does — the part that actually helps the model choose correctly — is a sixth of it. The names are a rounding error.
That immediately makes the standard advice suspicious. "Connect fewer MCP servers" and "keep your tool count down" both target the number of tools, and the number of tools is a bad predictor of what you pay. Across these ten servers the Pearson correlation between tool count and token cost is r = 0.518, so tool count explains about 27% of the variance. Tokens per tool ranges from 87.8 to 898.0, a 10.2x spread.
Look at the extremes in that table. GitHub gives you 26 tools for 3,562 tokens. Notion gives you two fewer tools for 4.7x the context. And sequential-thinking is a single tool costing 898 tokens — within 3% of what the entire nine-tool memory server costs.
If you are pruning your MCP config by counting entries in a list, you are optimising a variable that is only loosely coupled to the thing you care about.
The 30% that is one server repeating itself
Notion being expensive is not the finding. Why it is expensive is.
Nearly a third of everything measured is one server sending the same nine JSON Schema definitions twenty-four times, in one request.
Its largest tool schema, API-update-page-markdown, is 5,791 bytes, nests 10 levels deep, and carries seven oneOf/anyOf branches. Fine — Notion's page model is genuinely complicated. But look at what is inside it:
Nine $defs. And all 24 of Notion's tools carry the same nine, byte for byte:
$def
copies
bytes each
wasted bytes
movePageParentRequest
24
457
10,511
bulletedListItemBlockRequest
24
296
6,808
paragraphBlockRequest
24
278
6,394
richTextRequest
24
276
6,348
parentRequest
24
205
4,715
sortObject
24
189
4,347
dataSourceIdParentRequest
24
182
4,186
blockObjectRequest
24
100
2,300
pageIdParentRequest
24
127
2,921
10 rows × 4 columnsHeader row enabled
That is 48,530 redundant bytes — 68.1% of Notion's entire schema payload. In tokens: strip the $defs blocks and Notion's schemas fall from 15,780 tokens to 3,516, a 77.7% cut. Those 12,264 tokens are 30.1% of the whole 145-tool payload across all ten servers.
Let that land. Nearly a third of what I measured is one server sending the same nine JSON Schema definitions twenty-four times, in one request, to a model that will read all of them.
I checked whether this was general and it is not — Notion is the only one of the ten that does it. Every other server's $defs stripping saved exactly zero tokens, because they do not use $defs at all. So this is not "MCP is wasteful." It is one very popular server's schema generator inlining its shared definitions per-tool instead of hoisting them, and it is invisible unless you go looking, because from the outside it just looks like "Notion has a lot of tools."
The new spec is aware of this class of problem, incidentally — one of the 2026-07-28 minor changes adds "$ref resolution requirements and composition-keyword resource bounds" to inputSchema. Which will help, in whatever year the servers adopt it.
What that costs on real hardware
Tokens are an abstraction. Here is what 145 tool definitions do to a machine.
This is a Mac Studio, M3 Ultra, 28 CPU cores, 60 GPU cores, 96 GB unified memory. The model is Qwen3.8-27B in MLX 8-bit — affine, group size 64, which is the same class of quantisation I benchmarked against MXFP8 earlier this year — released 14 August 2026, so three days old at the time of measuring, Apache 2.0, 262,144-token native context. Runtime is mlx 0.32.0 / mlx-lm 0.31.3 in a venv, not LM Studio's bundled engine.
A warning before the numbers, because it cost me an hour and it will cost you one too. My first attempts at this produced garbage — one prefill that ran past ten minutes, two processes killed with no traceback at all. The cause was not the code. LM Studio had justInTimeModelLoading enabled and had quietly pulled a 34 GB llama.cpp server back into memory behind me; the machine was 67 GB into swap and I was timing paging, not prefill. If you benchmark local inference on a box that also runs a model server, check sysctl vm.swapusage and lms psbefore you believe a single number — a process killed with no traceback is the kernel telling you about memory, not Python telling you about a bug.
First, a detail that matters if you are counting tokens yourself: the 40,784 figure is the JSON your client sends. What the model reads is that JSON rendered through the chat template, which wraps every definition in its own envelope. The rendered prompt is meaningfully bigger than the payload:
tool payload
JSON tokens
rendered prompt
template overhead
KV cache
none
–
69
–
16 MiB
6 servers / 87 tools
11,795
15,431
+30.8%
976 MiB
10 servers / 145 tools
40,784
51,530
+26.3%
3,232 MiB
4 rows × 5 columnsHeader row enabled
If you are budgeting context, budget the rendered number.
The KV column is the one I would put on a sticker. This model is a hybrid: 64 layers, of which only every fourth is full attention, so 16 attention layers × 4 KV heads × 256 head dim × 2 (K and V) × 2 bytes works out to 64 KiB of KV cache per token. mlx-lm allocates that in 256-token steps, which is why a 69-token prompt still reserves 16 MiB — and that arithmetic predicted the measured 16.0 MiB exactly, which is how I know the layer accounting is right rather than plausible.
Run it forward and connecting ten MCP servers costs you 3.16 GiB of KV cache before the conversation starts. On a 96 GB machine that is survivable. On a 32 GB laptop, three gigabytes of tool definitions is the difference between a model fitting and not.
The comparison people reach for here is prompt caching, and on a hosted API it genuinely helps: tool definitions render first in the request, before the system prompt and messages, so a cache_control breakpoint on the last system block covers them, and a cache read costs about a tenth of the base input price. But the caching is a prefix match. Add one tool, remove one tool, or reorder the list, and the entire prefix invalidates — which is exactly why the new spec added that line about servers returning tools "in a deterministic order to enable client-side caching and improve LLM prompt cache hit rates." A server that shuffles its tool list is quietly costing every client a full cache rewrite on every call.
On your own hardware there is no billing to absorb — you pay in memory that stays paid for the length of the conversation.
What I could not measure, and why. I wanted wall-clock prefill for all three payloads and I only have one I trust: the no-tools baseline, 69 tokens in 0.398 s. The larger runs never got a quiet machine. lms ps is the command I should have run first — this box was serving two live agent workloads of my own over LM Link, actively generating, and every time I freed memory the just-in-time loader pulled a 30 GB server straight back in. The one large pass I did complete took 104 s for 15,431 tokens, but it was a first pass on a contended box, so treat that as a loose upper bound and not a benchmark. I am not going to evict live work to make a number prettier, and a timing taken at 63 GB of swap is not a timing. The token and memory figures above are unaffected by any of that — they are arithmetic over captured payloads and a validated cache layout, not wall-clock.
Skills are the other shape of this, and they are not a drop-in
The comparison that gets made is Agent Skills, so let me measure that too rather than repeat the marketing.
A skill is a directory with a SKILL.md. Anthropic's own documentation is clear about the mechanism: "a skill's body loads only when it's used, so long reference material costs almost nothing until you need it." At rest, the model sees the name and description from the YAML frontmatter; the body is read when the skill turns out to be relevant.
I have 21 real skills on this machine — not toys, the ones I actually work with. Measured with the same tokenizer:
tokens
discovery (name + description, always resident)
3,306
bodies (loaded only when used)
233,193
ratio
70.5x
4 rows × 2 columnsHeader row enabled
Median discovery cost is 154 tokens per skill, mean 157.4 — higher than it needs to be, because I write long descriptions deliberately. The description is the only thing the router sees when deciding whether a skill is relevant, so starving it to save 60 tokens is a false economy.
So: 3,306 resident tokens gate 233,193 tokens of material, against 40,784 tokens of MCP definitions that are all resident, all the time.
That comparison is real but it is not apples to apples, and anyone selling it to you as a straight swap is skipping the important part. A skill is instructions; a tool is an executable interface. A skill that tells the model how to file a Jira ticket still needs something that can make the HTTP call — usually Bash, or a tool. Skills do not remove your need for tools; they remove your need to have every tool's schema resident while the model decides what it is doing. The two solve adjacent problems and the honest framing is that progressive disclosure is a property MCP's tools/list does not have, not that skills replace MCP.
The protocol-level answer to this already exists on the API side — deferred tool loading, where schemas are declared but not loaded into context until something surfaces them — and that is the shape MCP itself will need. tools/list as specified hands you everything or nothing.
What I would actually do
Concretely, from the numbers above:
Measure your own payload before you prune anything. The whole exercise took a stdio client and a tokenizer. Capture tools/list, convert to your provider's tool shape, count. You will almost certainly find one server dominating, and it will probably not be the one with the most tools.
Check for duplicated $defs. It is a five-line check and it found 30% of my total in one place. tools here is the list straight out of a tools/list response:
python
1from collections import Counter
2defs = Counter()3for t in tools:4for k in(t.get("inputSchema",{}).get("$defs")or{}):5 defs[k]+=16print(defs.most_common())# anything with count == len(tools) is repeated in every tool
Prune by tokens, not by tool count.r = 0.518 is the whole argument. Dropping a 13-tool server to "reduce tool count" while keeping a 24-tool server that costs 14.7x as much is a rearrangement, not a saving.
Keep your tool list deterministically ordered if you run a server. It is one sorted() and it is the difference between your clients getting cache reads and cache writes. When we built an MCP server for document processing this was not something the spec asked for; as of 2026-07-28 it is.
Do not drop the initialize branch from your client. On the evidence of ten servers, 2026-07-28 is not in the field yet, and on the TypeScript and Go SDKs it does not arrive by upgrading.
The thing I keep coming back to is that this cost is invisible by construction. Nothing in a client tells you that connecting Notion costs you 16,772 tokens on every request, or that 12,264 of those are the same nine definitions repeated. You find it by capturing the wire format and counting — which is a thing I would rather have measured than assumed, given that the first version of this piece was going to be about a stateless handshake nobody has implemented.
What I did not measure
Two things, and I would rather name them than let you find them.
Wall-clock prefill on the large payloads, for the reason above — the machine was busy with live work and I was not willing to evict it twice more. The token counts and the KV footprints stand on their own; the latency numbers are simply absent rather than estimated.
Tool-selection accuracy. Whether a local model still picks the right tool with 145 of them resident, versus only the owning server's, is the question I most want answered and the one this piece does not answer. It needs a quiet machine for about an hour. If you want to run it before I do, the collision is already there: update_issue exists in both the GitHub and Sentry servers, and only the mcp__<server>__ prefix tells them apart — so a model that ignores the prefix will close the wrong kind of issue.
Everything else above is measured on the machine described, on the dates given, and the commands are in the piece, so you can disagree with me by running them.
CogniRunner Coder: a Jira coding agent that commits to GitHub from the issue
A Jira coding agent that works inside the issue: it reads your GitHub repository, plans, stages the edits, and on its default setting commits or opens a pull request only after you confirm a card, with the commit card naming every file. Walked end to end on our production build, with the pull request it opened and how to check it, and what 5.2.0 changed.