
Jira automation usage billing from 3 December 2026: step counts we measured on real rules

Key takeaways
- Each component that runs is billed as one step. The Usage tab's numbers matched the audit log's component counts exactly for the 11 rules we built on 15 October 2026.
- A run that stops at a failed condition still cost 2 steps (trigger plus condition). A scheduled rule whose JQL found nothing cost 1 step per run, which is 8,640 steps a month if it runs every 5 minutes.
- Branches bill per item: one transition on a parent with 5 sub-tasks cost 7 steps (trigger 1, branch 1, comment 5). A scheduled sweep over 6 work items cost 7 per run.
- An if/else-if/else block bills each branch it tests: the first branch cost 4 steps per run, the else branch 6.
- Ticking 'Only include work items that have changed since the last time this flow executed' did not help when the rule's own comment changed the items: it swept all 6 again, even on a run where its own comment was the only change.
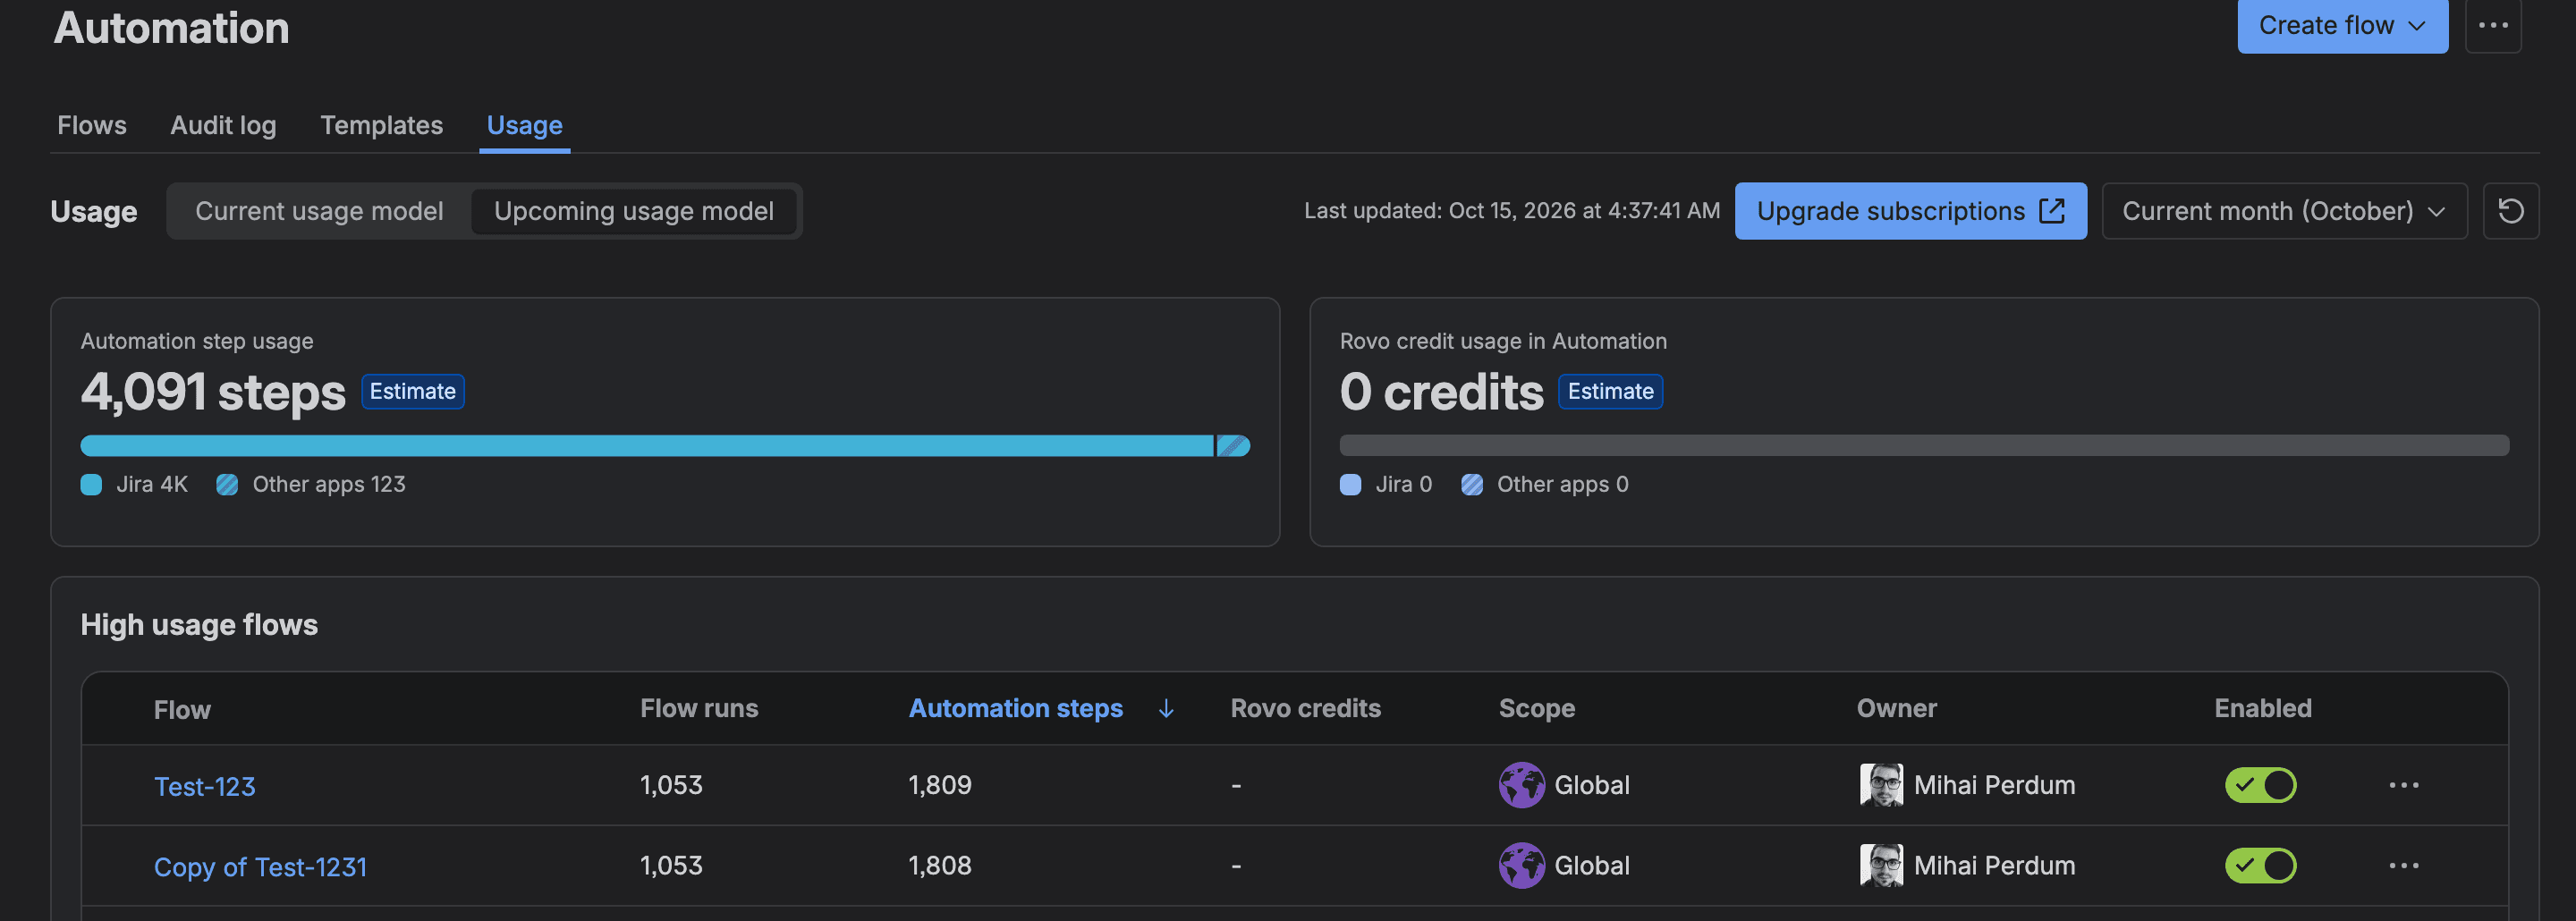
- On our own test site, two forgotten copies of a year-old test rule (comment deleted, send an email) used 3,617 of the 4,091 steps this month, 88%.
In September, Tanner Jenkins asked on the Atlassian Community why his automation steps ran "up to 150,000 steps in a single day" when his own sum for a whole month came to less than 20,000, and nobody from Atlassian answered. So we measured it: on our test site a rule whose condition said no still cost 2 steps, and a scheduled rule that found nothing cost 1 step each time it woke up. A branch over 5 sub-tasks cost 7.
On 15 October 2026 we built 11 everyday automation rules there, ran each one on purpose and read what each run cost from Jira's own Usage tab.
Our bigger surprise wasn't in the experiment at all. When we opened the Usage tab, 88% of our site's steps this month came from two copies of a test rule somebody made a year ago and forgot. It emails whoever deletes a comment, and something on our site deletes a lot of comments (I suspect our own test tools, which clean up after themselves).
From 3 December 2026 Atlassian bills those steps. I've kept what Atlassian documents and what we measured apart, because they don't always agree. Atlassian now calls automation rules "flows" on its screens, so you'll see both words here.
Prerequisites — Jira Cloud (any paid plan; the numbers here are from a company-managed software project). To see per-rule steps you need Jira admin rights for Settings > System > Automation. To see the org total you need organization admin in Atlassian Administration. The optional command in step 6 of the usage check needs an Atlassian API token, curl and jq. Everything below was measured on 15 October 2026 and Atlassian's prices were read on Atlassian's own pages the same day.
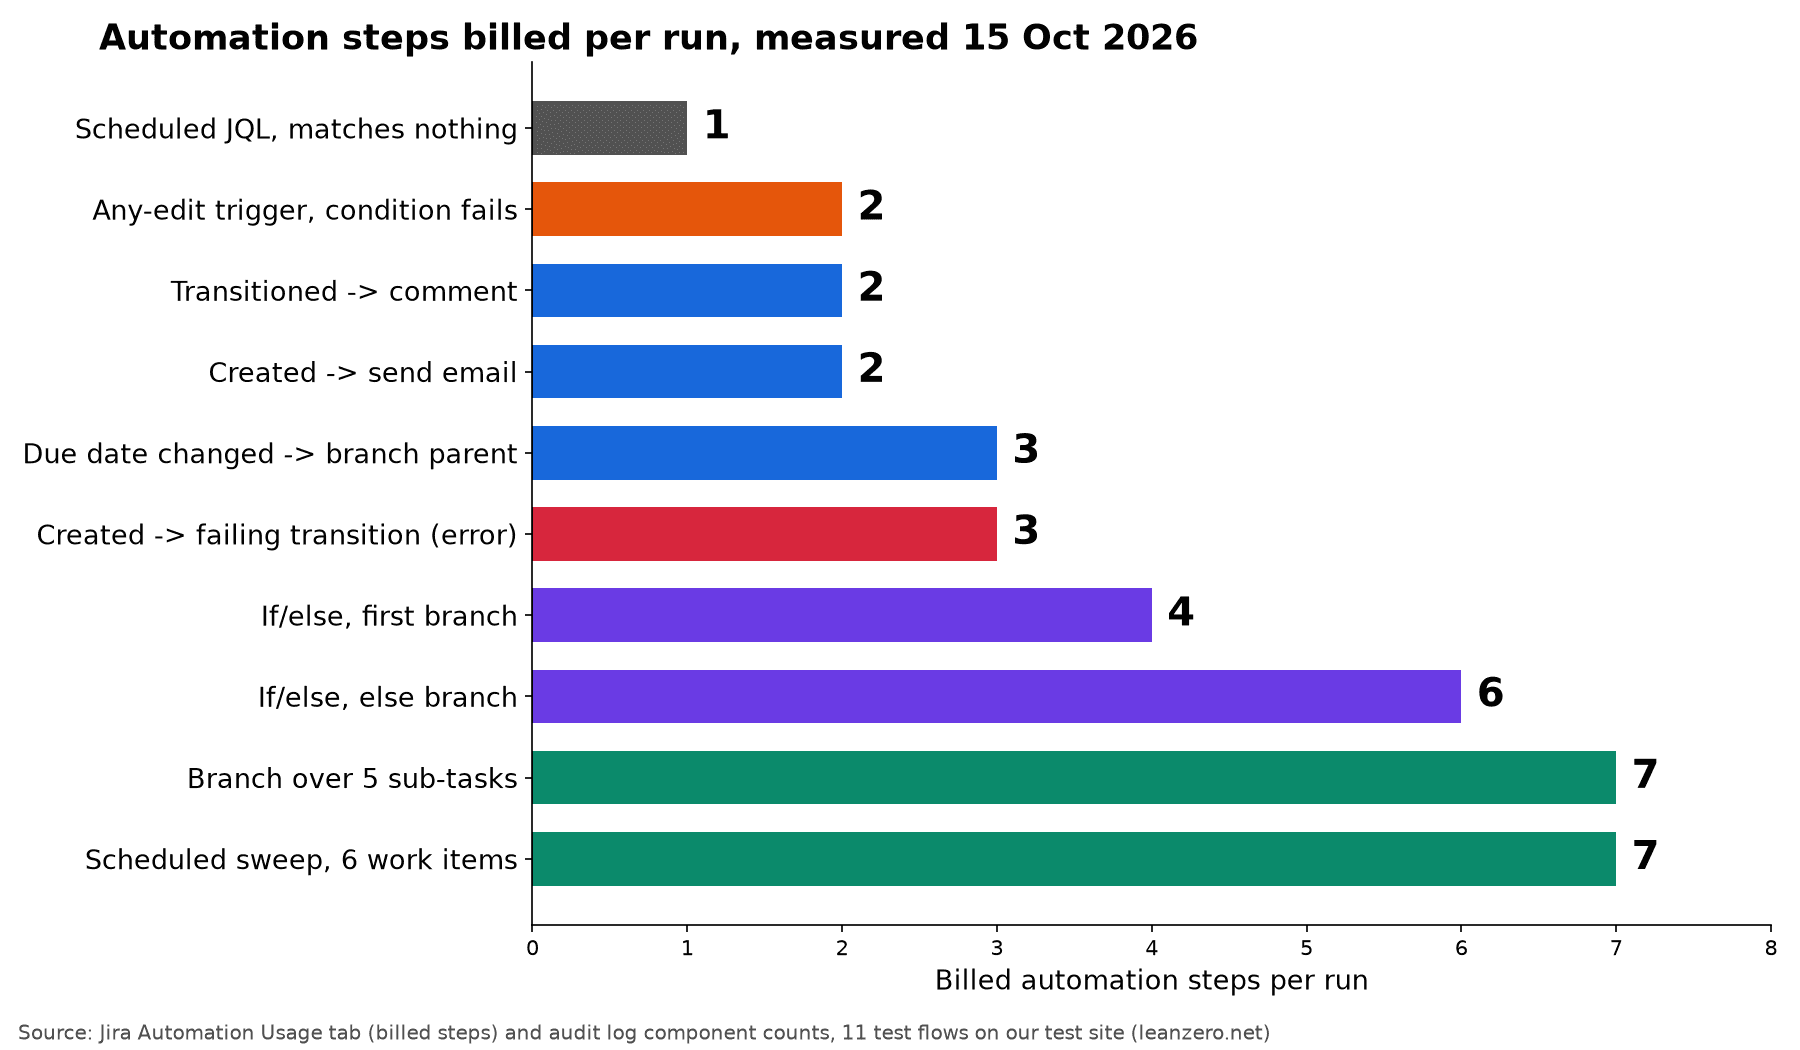
Seven things we measured
- A run that stops at a failed condition costs 2 steps. Three edits that didn't match a JQL condition cost 2 each (trigger plus condition), and the matching edit cost 3.
- A scheduled rule that finds nothing costs 1 step per run. Two runs, 2 steps. At every 5 minutes that's 8,640 steps a month for a rule that never does anything.
- Branches bill per item. A parent with 5 sub-tasks cost 7 steps for one transition (trigger 1, branch 1, comment 5). The same rule on a parent with no sub-tasks cost 2.
- A scheduled JQL sweep bills one action per matching work item, on each run. 6 work items, one comment each, 7 steps a run.
- If/else bills each branch it checks. The first branch cost 4 steps, the else-if 5 and the else 6, for the same single label edit.
- Errors don't make a run free. A rule whose transition failed (status "Some errors") still cost 3 steps a run.
- "Only changed work items" didn't save anything when the rule changes the items itself. Its own comment counted as a change: on the one clean run, all 6 work items came back anyway.
What counts as an automation step, according to Atlassian
Atlassian's support page How is your automation usage calculated (last published 4 September 2026) says: "Every trigger, condition, action, branch, and loop that runs in a flow counts as a step toward your usage." It also says that "even if a trigger doesn't find a match to start the rest of the flow, the trigger execution itself is charged as one step."
The same page lists the run statuses that are charged: success, no actions performed, some errors, aborted and no match. Throttled runs "where no step actually executes" aren't charged, and neither are errors on Atlassian's side. The Rovo components (Use Rovo, Use agent, Use Jira Coding agent) bill as Rovo credits, so they don't use automation steps.
It's a real change from how many of us learned automation. Under the old run-based model, a rule that ran but didn't do anything didn't count. Atlassian's own KB about automation limits (dated 7 May 2026) still says "Runs that fire but perform no action (filtered out by a condition) do not count", and the best-practices page from 29 May still says "Only flows that perform a successful action will count toward your usage." Both are out of date for steps. Our measurements agree with the September page.
The docs don't say how branches, if/else blocks and scheduled sweeps are counted.
Jira automation usage limits from 3 December: the step allowance per plan
These are per user per month, pooled across the whole organization for each meter, reset monthly with no rollover. We read them on the support page above and on Atlassian's pricing pages on 15 October:
App | Free | Standard | Premium | Enterprise |
|---|---|---|---|---|
Jira | 150 per subscription | 400 | 750 | 1,000 |
Confluence | 50 per subscription | 100 | 250 | 500 |
Jira Service Management / Service Collection | 1,250 per subscription | 3,000 | 6,500 | 9,500 |
Teamwork Collection | 200 per subscription | 2,500 | 5,000 | 7,500 |
Steps beyond the allowance cost $0.50 per 1,000, billed from 3 December 2026. Atlassian says extra usage is "enabled by default" for most organizations, with alerts at 80% and 100%. If extra usage is off and the pool runs out, new flows stop until the reset, flows already running finish, the events you missed aren't replayed, and manual-trigger flows pause too.
Atlassian's pages disagree with each other in two places, so here are both sides. The usage-based pricing FAQ lists the Free allowances "per user, per month", while the support page and the pricing pages say "per subscription". And the licensing FAQ says "Enterprise plans will no longer have unlimited automation", while the Jira pricing page still describes Enterprise as having "unlimited automation" a little further down the same page that lists 1,000 steps per user. I'd budget on the step numbers.
The 11 rules we built and the steps each one used
All 11 lived in one test project, with no other project rules in it. We created them disabled through Atlassian's automation REST API (the same one from our Jira Automation Rules API agent skills post), switched each on by itself or with the one rule it was compared against (the scheduled ones overlapped with later tests), did the thing that triggers it with a few REST calls, and switched it off 45 seconds later. Scheduled rules ran every 5 minutes for two or three runs.
Then we read two places. The Usage tab gives billed steps per rule. The audit log gives, per run, how many times each component executed. For all 11 rules the two agreed exactly once the Usage tab had caught up, so the audit log tells you where a rule's steps go.
Rule | What happened | Runs | Billed steps | Per run |
|---|---|---|---|---|
Transitioned to Done → comment | 3 transitions to Done | 3 | 6 | 2 |
Any edit → JQL condition (priority = Highest) → add label | 3 description edits, 1 priority change | 4 | 9 | 2, 2, 2 and 3 |
Priority changed (field filter on the trigger) → same condition → add label | the same kind of edits | 2 | 5 | 2 and 3 |
Due date changed on a sub-task → branch to parent → comment | 2 due-date edits | 2 | 6 | 3 |
Transitioned to In Progress → branch over sub-tasks → comment | parent with 5 sub-tasks, parent with none | 2 | 9 | 7 and 2 |
Scheduled, JQL matches 6 work items → comment | 2 runs | 2 | 14 | 7 |
Scheduled, JQL matches nothing → comment | 2 runs | 2 | 2 | 1 |
Created → if / else if / else on priority → add label | Highest, High, Low | 3 | 15 | 4, 5, 6 |
Created → transition that doesn't exist → comment | 3 creates, all "Some errors" | 3 | 9 | 3 |
Created → send email | 2 creates | 2 | 4 | 2 |
Scheduled, 6 work items, "only changed since last run" ticked → comment | 3 runs | 3 | 21 | 7, 7, 7 |
Sending an email cost 1 step, the same as adding a comment.

A failed condition still costs the trigger and the condition
The "any edit" rule ran on every edit in the project. Three times the JQL condition said no, and each of those runs is in the audit log as "No actions performed" with two components executed. Of the two members who replied in Tanner's thread, one pointed him to the doc, and the other said that if a condition stops a rule halfway, the later steps don't count. That held for us: the action after the failed condition never ran and was never billed.
Branches multiply
Over sub-tasks, the branch ran its comment action once per sub-task, and each of those was a step. On a parent with no sub-tasks the branch still counted as a step, with nothing inside it. So a rule that is just a trigger and a branch costs 2 plus (actions inside × items). By that arithmetic a parent with 50 sub-tasks and one action inside the branch would cost 52 steps per transition. We tested 5, not 50.
If/else charges for every question it asks
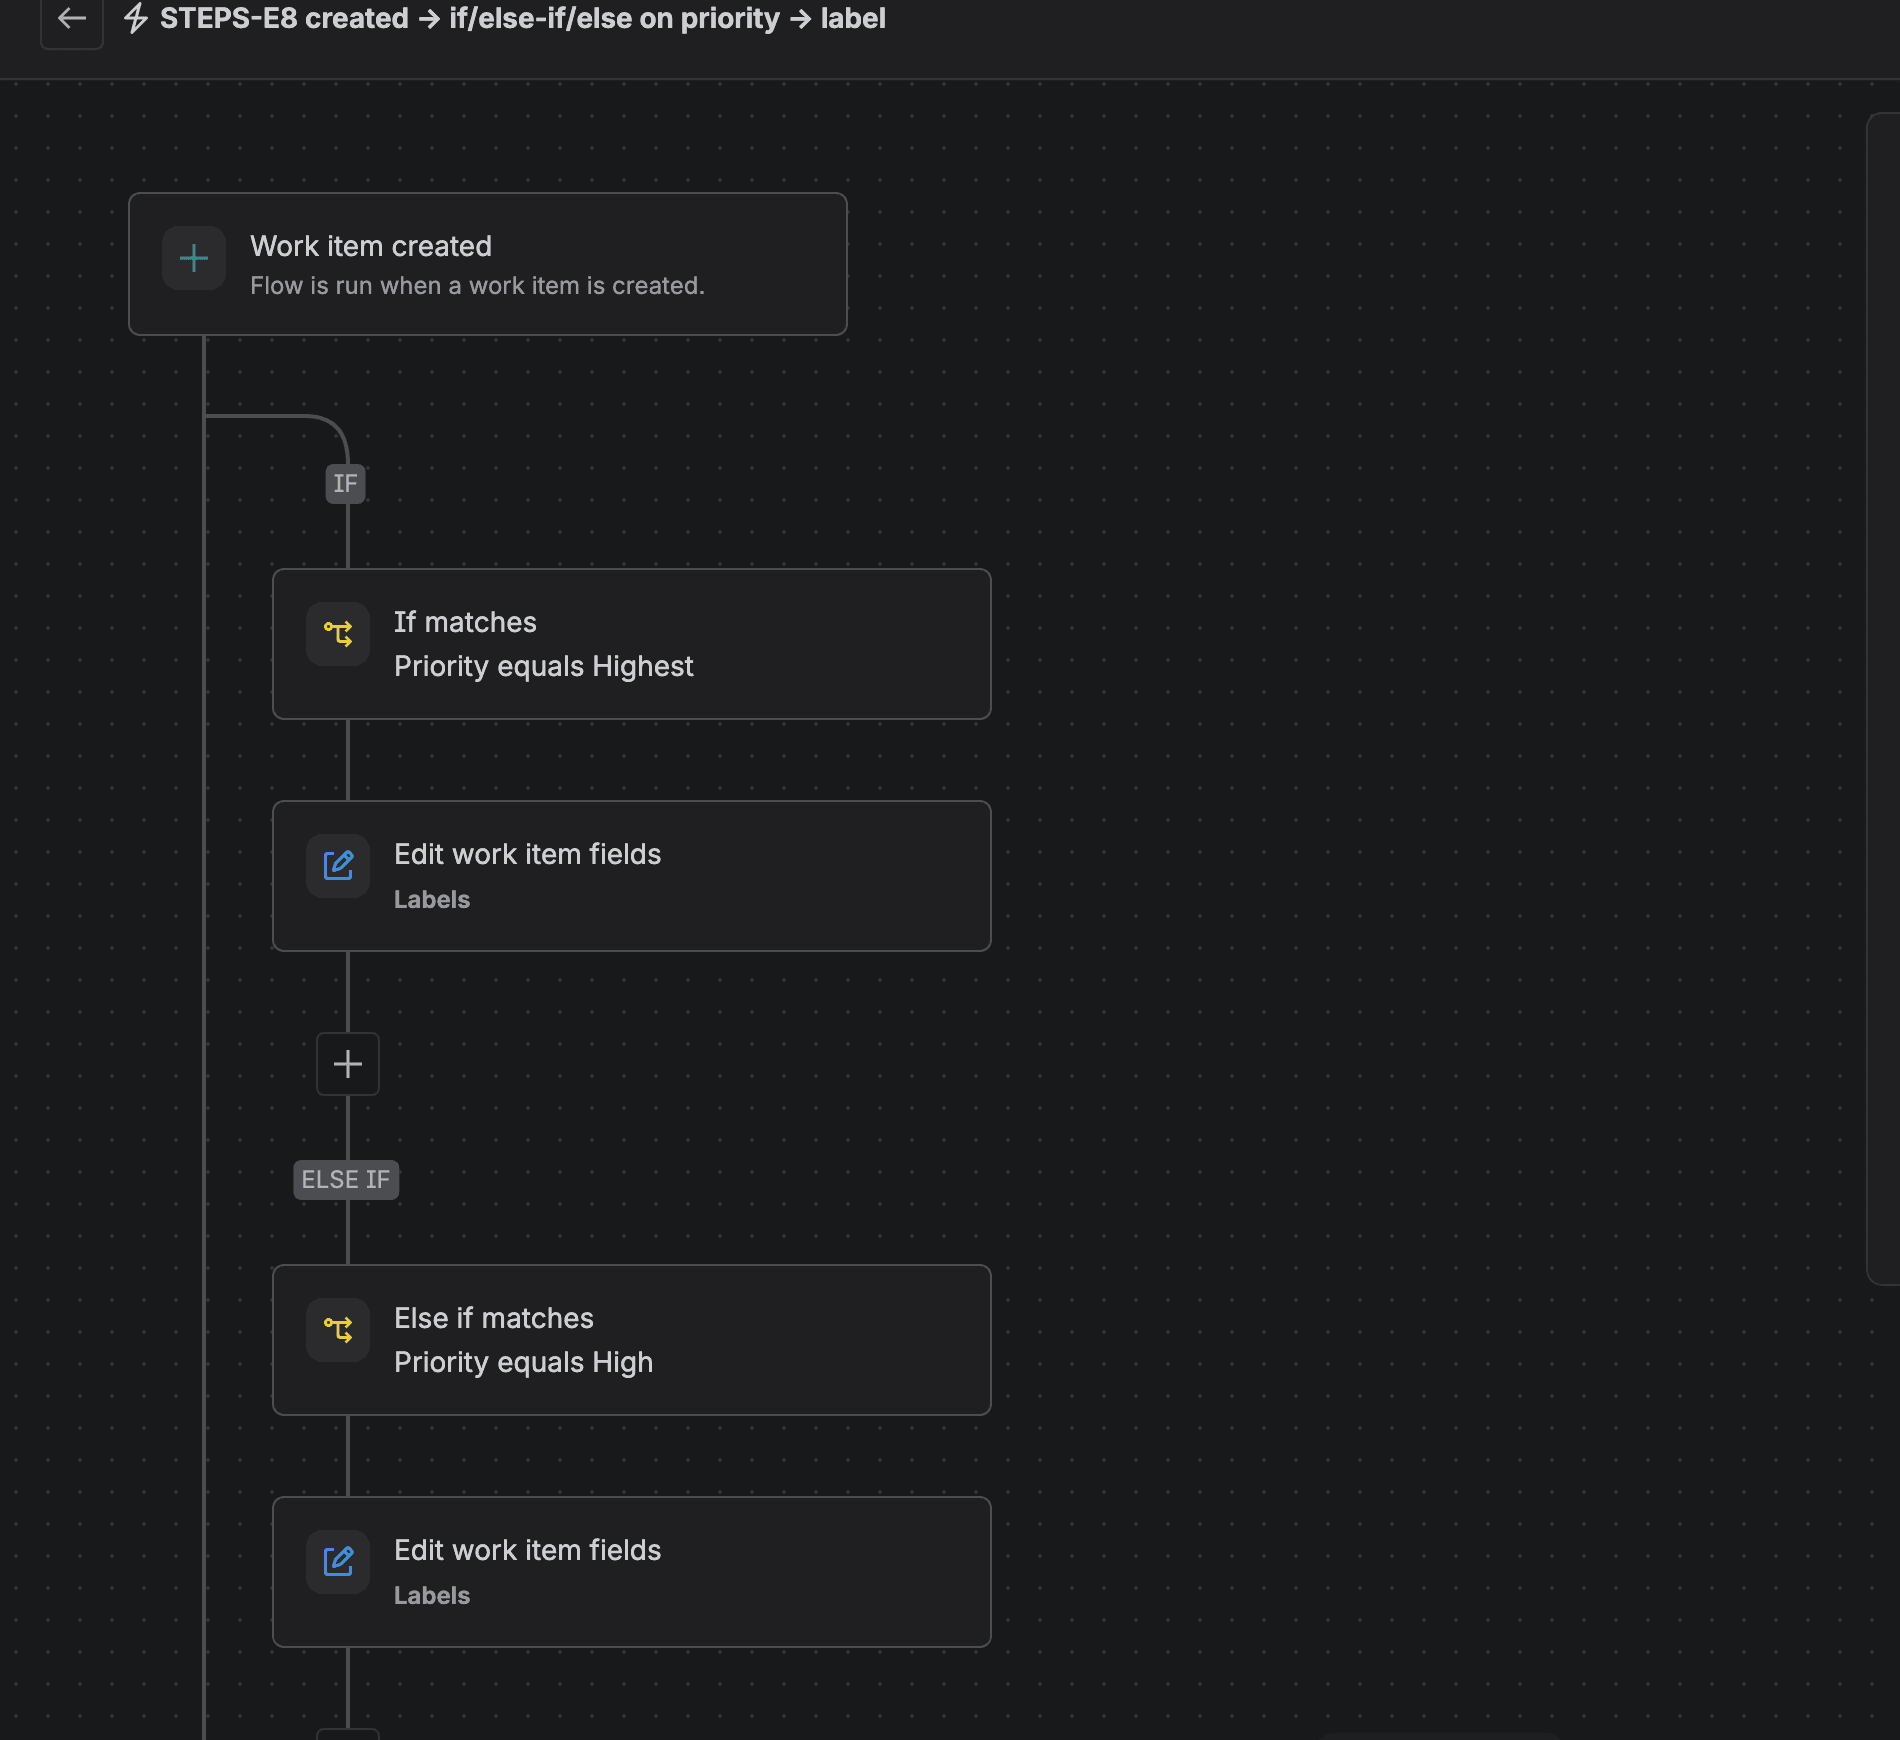
The audit log showed the if/else container as one condition block, plus one block for each branch it tested. A work item with priority Highest stopped at the first test (4 steps). A Low one went through Highest, High and the else (6 steps). If most of your work items end up in the else, put the most common case first.
Errors are billed
Our rule with an impossible transition failed on all 3 runs, and showed "Some errors". It was still billed. Each run cost 3 steps, including the comment that ran after the error. Atlassian's page says business errors are charged, and this is what that looks like. A rule that has failed for months without anyone noticing is now also spending.
The "only changed work items" box can catch its own tail
In the scheduled trigger there's a checkbox to include only work items that have changed since the last time the flow executed. Atlassian's builder code sets it on by default for a new scheduled trigger (we read that in the code and didn't click through the screen to confirm). We expected it to cut the sweep to nothing once nothing else was touching those 6 work items. It didn't. The rule adds a comment, a comment updates the work item, and the next run sees 6 changed work items again. Another sweep rule, E6, also commented on the same 6 items at 04:35, so E11's second run proves little. The third run at 04:45 is the clean one: by then the only change to those items was E11's own comment, and it still swept all 6 for 7 steps.
The Usage tab took a while on this one. At 04:45 it already counted all 3 runs but only 7 steps, and by 04:55 it showed 21, the same as the audit log.
How to check Jira automation usage: the Usage tab and Platform usage
There are two screens, and they answer different questions. The Usage tab tells you which rules spend. Platform usage tells you how close the whole organization is to its allowance. We found no documented public API for either: AUTO-1699, "Official REST API to check the current Jira automation usage per product", had 44 votes on 15 October.
- 1
Open the Usage tab
In Jira, go to Settings > System > Automation (the address ends in /jira/settings/automation) and select the Usage tab. Leave the period on Current month. The tab has Current usage model and Upcoming usage model toggles; ours showed the same step table on both.
- 2
Sort High usage flows by Automation steps
Look at the top five rows and their scope. Write down any flow with Global scope that you don't recognise, and any "Deleted flow (id: …)" rows. Deleted rules keep their history here, and the name is gone, so the id is all you get. If most of your top rows say "Deleted flow", that may be a known bug (AUTO-2506, waiting for release) rather than deleted rules: one customer there suggests asking Atlassian support to enable the Upcoming usage model view, which showed them the real names. On our site the deleted rows really were deleted rules.
- 3
Divide steps by runs for each top flow
Our Test-123 did 1,809 steps in 1,053 runs, about 1.7 a run. A ratio close to 2 on a "Work item updated" rule with a condition right after the trigger means most runs stop at the condition: give it a field-filtered trigger. A ratio of 1 on a scheduled rule means its JQL keeps finding nothing: run it less often or switch it off. A ratio far above 5 usually means a branch or a sweep over many work items.
- 4
Open one run in the Audit log
Filter the Audit log by the flow and expand a run. A status of "No actions performed" means you paid for a run that changed nothing, and "Some errors" means you paid for a run that failed. You should see those statuses on the runs that cost steps but did nothing. Count how many of the recent runs have each status: a rule where most runs say "No actions performed" has a trigger that's too broad or, on a scheduled rule, a JQL that keeps finding nothing (run it less often). The audit log keeps 90 days.
- 5
Check the org total in Atlassian Administration
Go to admin.atlassian.com, select Insights, then Platform usage, then Automation steps. Read Allowance used against Allowance, and look for an Enable extra usage button. If it's there, extra usage is off right now. On our org the page data gave the reason as "meter not onboarded", so it may switch to Atlassian's default (on, for most organizations) when billing starts. Check again after 3 December.
- 6
List the site-wide rules nobody owns
Run the command below. It prints the enabled rules whose scope is the whole site, with the date it was created. An old global rule nobody recognises is what you're looking for.
1curl -s -u "$EMAIL:$API_TOKEN" \
2  "https://api.atlassian.com/automation/public/jira/$CLOUD_ID/rest/v1/rule/summary?limit=100" \
3  | jq -r '.data[] | select(.state=="ENABLED") | select(any(.ruleScopeARIs[]; test(":site/")))
4           | [(.created|floor|strftime("%Y-%m-%d")), .name] | @tsv'
On our site it printed this on 15 October:
12026-09-08	Classification changed in Assets - sync Confluence space
22025-10-31	Copy of Test-1231
32025-10-31	Test-123
You should see one line per enabled site-wide rule, and no output means you have none. The first is a September rule that syncs an Assets classification to Confluence, which we know about. The other two are the rule that used 88% of our steps. CLOUD_ID is your site's cloud ID (open https://<your-site>.atlassian.net/_edge/tenant_info), and the endpoint returns up to 100 rules per page, so follow the links.next cursor if you have more.
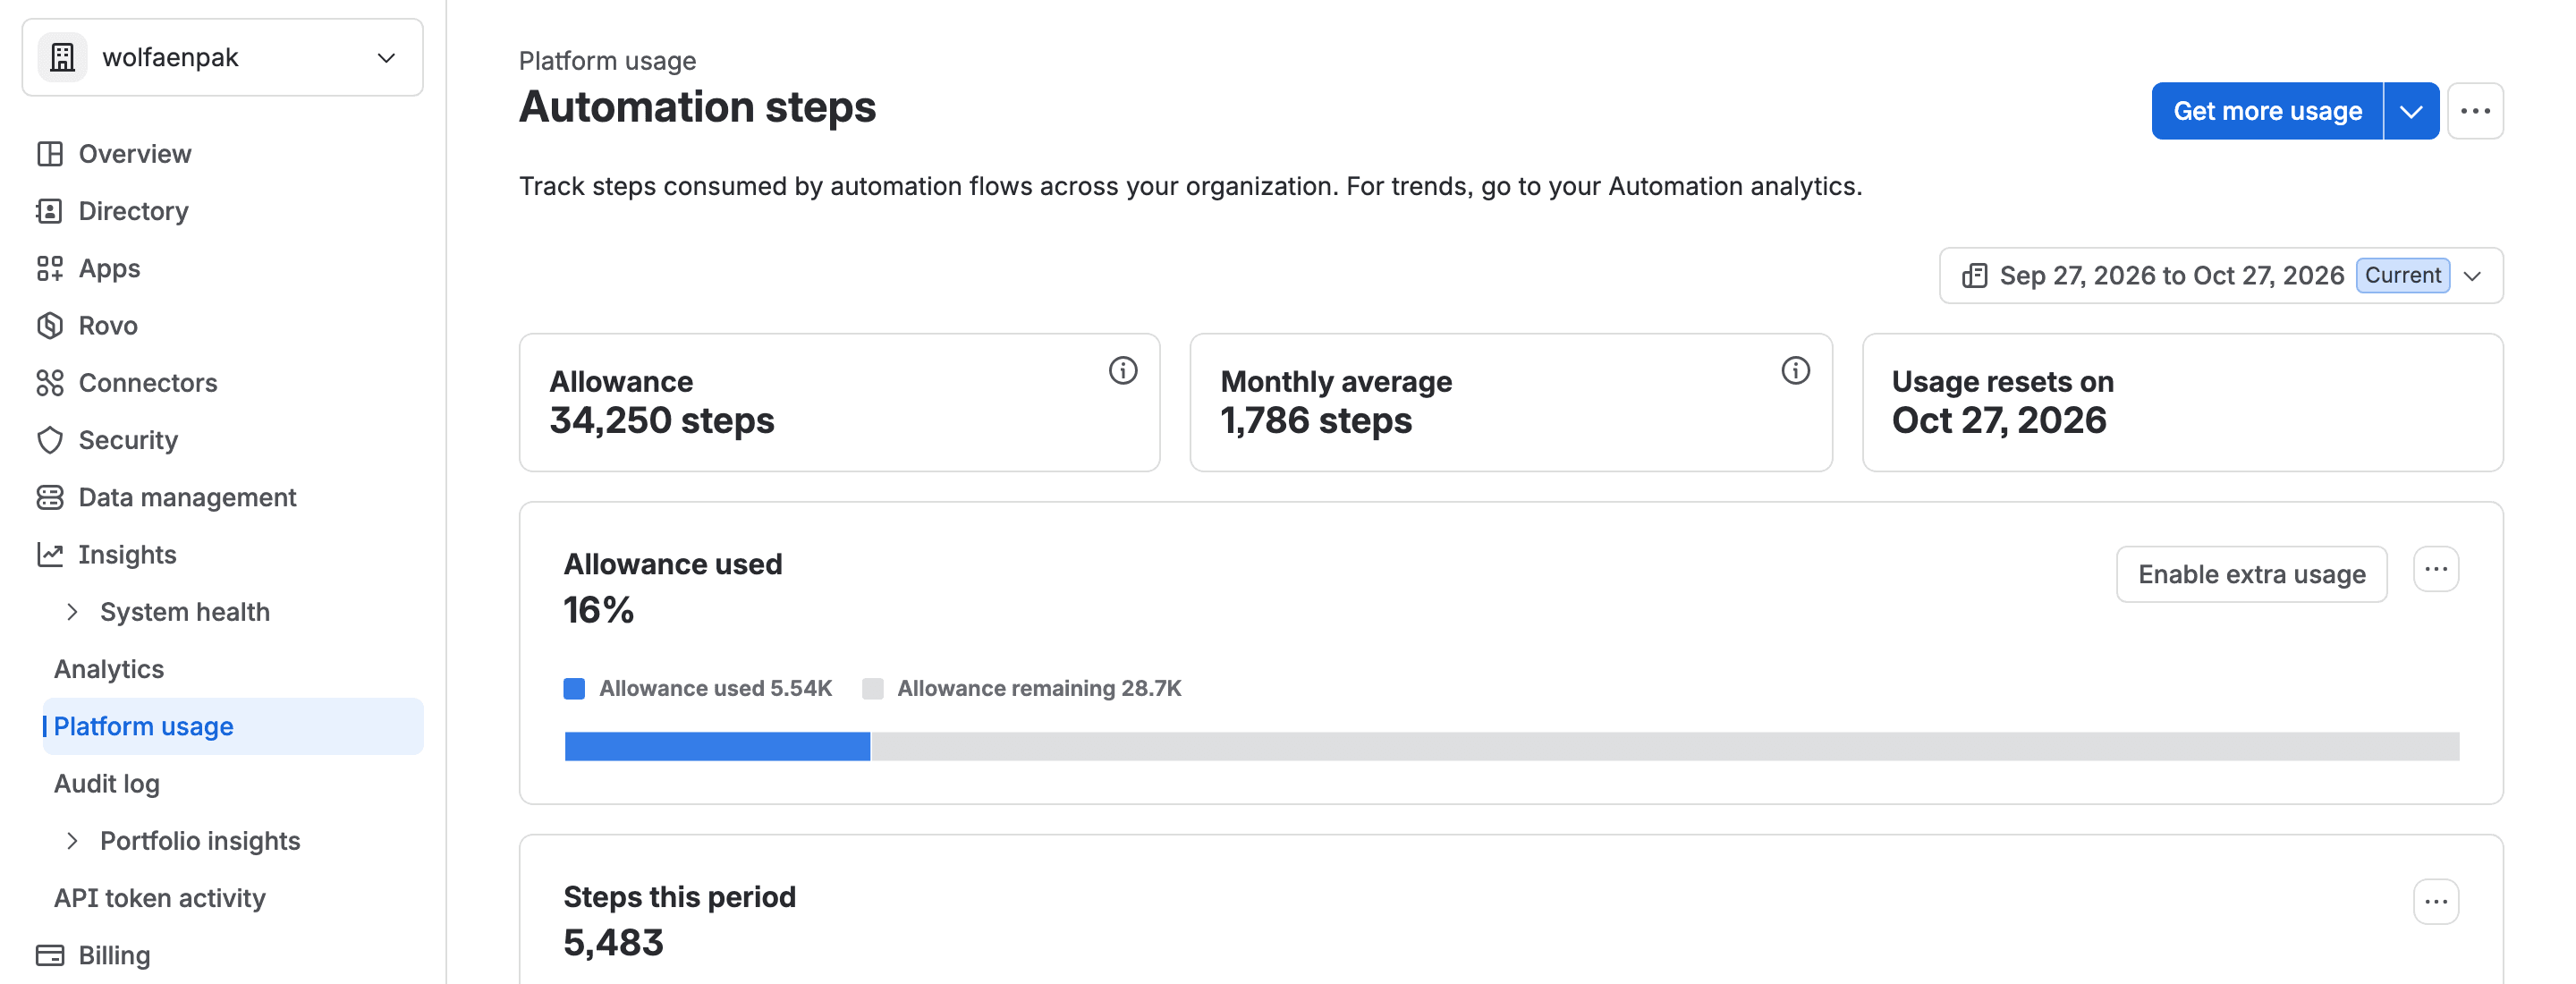
How long is the deleted-flow list on your site? Ours had 26 deleted flows this month with 265 steps between them, and the Usage tab can't tell you what any of them did.
The Usage tab confused us twice the first time. It lags: runs we made at 04:20 showed up at 04:26, and some took about 15 minutes. And the two screens count different windows. Their totals never match.
Reading step counts in the Jira automation audit log
The run view in the audit log lists the components that ran, but not how many times each one ran. The counts sit in the record the page loads for each run (componentLogs, field totalExecutions). For our branch rule it was 1 for the trigger, 1 for the branch and 5 for the comment. Add those up across a rule's runs and you get exactly the number on the Usage tab, which we checked for all 11 rules.
- 1
Filter the Audit log by one flow
On the Audit log tab, filter to the expensive flow and the same calendar month the Usage tab shows.
- 2
Expand a run that cost steps
Pick one with status "No actions performed" or "Some errors" first: a "No actions performed" run cost steps and changed nothing, and a "Some errors" run cost steps for a job that didn't finish. If the rule has a branch, expand it too: the per-item actions run inside it, and a branch over many work items is usually the reason for a high steps-per-run number.
- 3
Compare with the Usage tab
Multiply the flow's runs by the components a full run executes. If the Usage tab is well above that, a branch or sweep is multiplying; if it's below, many runs stopped early (check the statuses from step 2). Our Test-123 is the second case: 1,053 runs of a 2-component rule would be 2,106 steps, and the tab shows 1,809.
- 4
Read the exact counts if you need them
Open your browser's developer tools on the Network tab, expand a run in the audit log, and type auditlog/item into the Network filter box (the address ends in ?startTime= and a timestamp). In its response, content.componentLogs has a totalExecutions for each component. Our per-run numbers came from there, and their sum should be the Usage tab figure once it has caught up.
Atlassian's tracker has a caveat, though: with Conditional branching set to "First match", the run view leaves out the branch and the actions inside it (AUTO-2475; the workaround there is "Any match"). We didn't check whether the underlying counts are affected.
Our audit read stopped at the newest 1,000 entries on the site, which covered 285 of Test-123's 1,053 October runs (4 to 14 October): 161 "Success", 108 "Some errors" and 16 "No actions performed". So even this forgotten rule mostly ran to the end, and its average of 1.7 steps a run is a mix we couldn't break down per status.
What a wasteful rule costs: one rule before and after
I'd probably start most sites with this rewrite, because it touches the busiest trigger and changes nothing about what the rule does. Take a rule that should react to a priority change but listens to all edits:
Before, the trigger is "Work item updated" (any edit), then a JQL condition priority = Highest, then add a label. In our test it cost 2 steps for each unrelated edit and 3 for the one that mattered.
After, the trigger is "Field value changed: Priority", with the same condition and the same label. Description edits didn't start it at all. It cost 2 when the priority changed to something else and 3 when it changed to Highest.
The saving is 2 steps for every edit that isn't a priority change. A project with 3,000 edits a month and one rule like the "before" version spends about 6,000 steps on that rule, most of them on runs that do nothing. That number is an example, so count your own edits before you trust it.
Run scheduled rules less often, too: one that finds nothing costs 1 step a run, so 8,640 a month at every 5 minutes, 720 hourly and 30 nightly. Narrow the JQL of scheduled sweeps, because each matching work item costs its actions on each run (a nightly sweep over 200 work items with one action is about 6,000 steps a month). Put the most common case first in an if/else. And fix or switch off failing rules. They're billed like working ones.
Some rules exist only to stop a transition when a field is wrong. A workflow condition or validator does that on the transition itself, without running an automation flow. Full disclosure, CogniRunner is ours: it adds AI-checked conditions and validators to Jira workflows.
Jira automation cost: how much money this is, and when it matters
On our test site it's small. If they ran above the allowance, our two forgotten test rules would cost about $1.81 for the month at $0.50 per 1,000 steps, and a 5-minute scheduled rule that never matches $4.32. Inside the allowance they cost nothing, but they still use up the pool.
At company size the pool is bigger, and so is the overage when you blow through it. On Jira Standard alone, 50 seats give 20,000 steps a month, 600 seats 240,000 and 2,000 seats 800,000.
Tanner's numbers are the warning. He said his team was going from "35 Million automations" to 350,000 on Customer Service Management Premium. Say that 350,000 is his monthly step pool and 150,000 a day held all month (he doubted it himself). Then he'd be about 4.15 million steps over, roughly $2,075 a month at list price.
If your site also runs Jira Service Management or one of the Collections, the picture changes a lot. Service Collection (Jira Service Management) seats bring 3,000 to 9,500 steps each on paid plans, and Teamwork Collection seats 2,500 to 7,500, against Jira's 400 to 1,000. All of it goes into one org pool for the automation meter. A mixed site can absorb rules that would sink a Jira-only one.
Between "extra usage on" and "off" there are two more controls. You can set a monthly limit on extra usage, and Atlassian's usage packs page lists automation step packs from 40,000 steps for USD 20 a month (the same $0.50 per 1,000). Atlassian's FAQ still calls packs "coming soon", so check what your billing page offers.
The allowance can hurt, though. A 20-user Jira Standard site gets 8,000 steps a month, and that one 5-minute rule uses 8,640. If your org has extra usage switched off, then once the pool is empty your flows stop until the reset, including the ones that matter, and the events in between are never replayed. The question for most admins is whether a broken rule can stop the good ones, and the money comes second.
The audit I'd do before 3 December
It's an afternoon's work. Do steps 1 to 6 above and write down the top 10 flows by steps. For each, note the share of "No actions performed" runs (a high share means a narrower trigger, or a less frequent schedule) and the steps per run (above 5 means a look at its branch or sweep). Ask the owner of each old global rule whether it's still needed, and switch off what nobody claims (you can switch it back on). Fix or disable the rules that show "Some errors", and check how often each scheduled rule really needs to run.
Then decide about extra usage in Atlassian Administration. If it's on, the bill grows without asking. If it's off, rules stop when the pool empties. I think most teams are better off with it on and the 80% and 100% alerts switched on, so nothing stops mid-month, but that's a call for whoever owns the budget.
On our own site I'd start with Test-123.
Where I could be wrong
Everything above comes from one test site on one day, a company-managed software project and 11 rules. We didn't test loops, smart-value conditions, lookups, manual triggers or Jira Service Management rules, and we didn't try a rule that runs out of the allowance. The Usage tab says "Estimate" next to its total, and Atlassian doesn't document the per-rule table yet (AUTO-2482 asks for a step counter in the builder). If your numbers come out differently, tell me, because I'd like to know where the counting changes.
If you've moved rules between sites recently, check the actor and scope too: our JCMA actor and scope tutorial covers what a migration does to them. And if your notify rules send more email than you expected, the sendNotifications tutorial explains why.
Key takeaways
- You can read billed steps per rule in Jira's Usage tab, and the audit log's component counts show where they go. A run costs one step per component that executes, including a trigger that matches nothing and a condition that says no.
- Branches and scheduled sweeps multiply by the number of work items, and if/else adds a step for each branch it tests. Failed runs are billed, and "only changed work items" doesn't help when the rule changes the items itself. The quickest saving on most sites is a narrower trigger and a look at old global rules nobody owns.
Have you opened your own Usage tab yet? I'd love to hear which rule came out on top.
Tags
Have Questions?
Join our Discord community to ask questions and get help with implementing this tutorial.
Join Discord
Comments
0Add a comment